Big Drop In June Temperatures According To UAH
By Paul Homewood
Roy Spencer has news of a big drop in satellite temperatures last month:
Second largest 2-month drop in global average satellite temperatures.
Largest 2-month drop in tropical average satellite temperatures.
NOTE: This is the fifteenth monthly update with our new Version 6.0 dataset. Differences versus the old Version 5.6 dataset are discussed here. Note we are now at “beta5” for Version 6, and the paper describing the methodology is still in peer review.
The Version 6.0 global average lower tropospheric temperature (LT) anomaly for June, 2016 is +0.34 deg. C, down 0.21 deg. C from the May value of +0.55 deg. C (click for full size version):
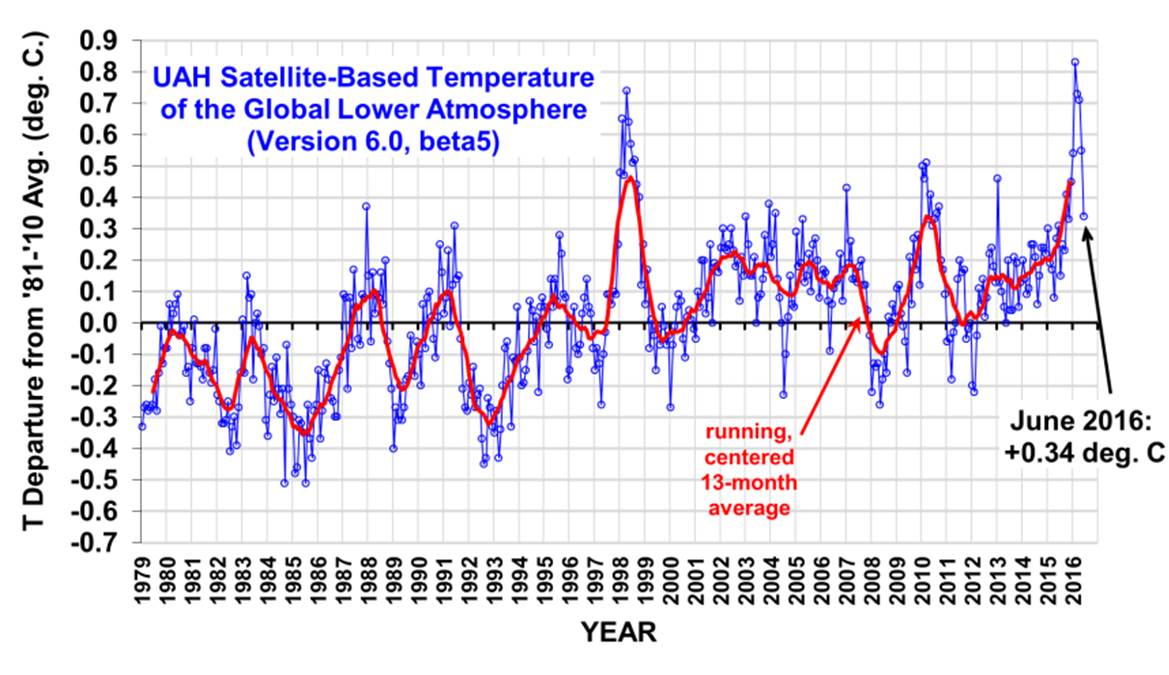
This gives a 2-month temperature fall of -0.37 deg. C, which is the second largest in the 37+ year satellite record…the largest was -0.43 deg. C in Feb. 1988.
In the tropics, there was a record fast 2-month cooling of -0.56 deg. C, just edging out -0.55 deg. C in June 1998 (also an El Nino weakening year).
The rapid cooling is from the weakening El Nino and approaching La Nina conditions by mid-summer or early fall.
As promised just over a week ago, here’s how we are now progressing toward a record warm year in the satellite data:
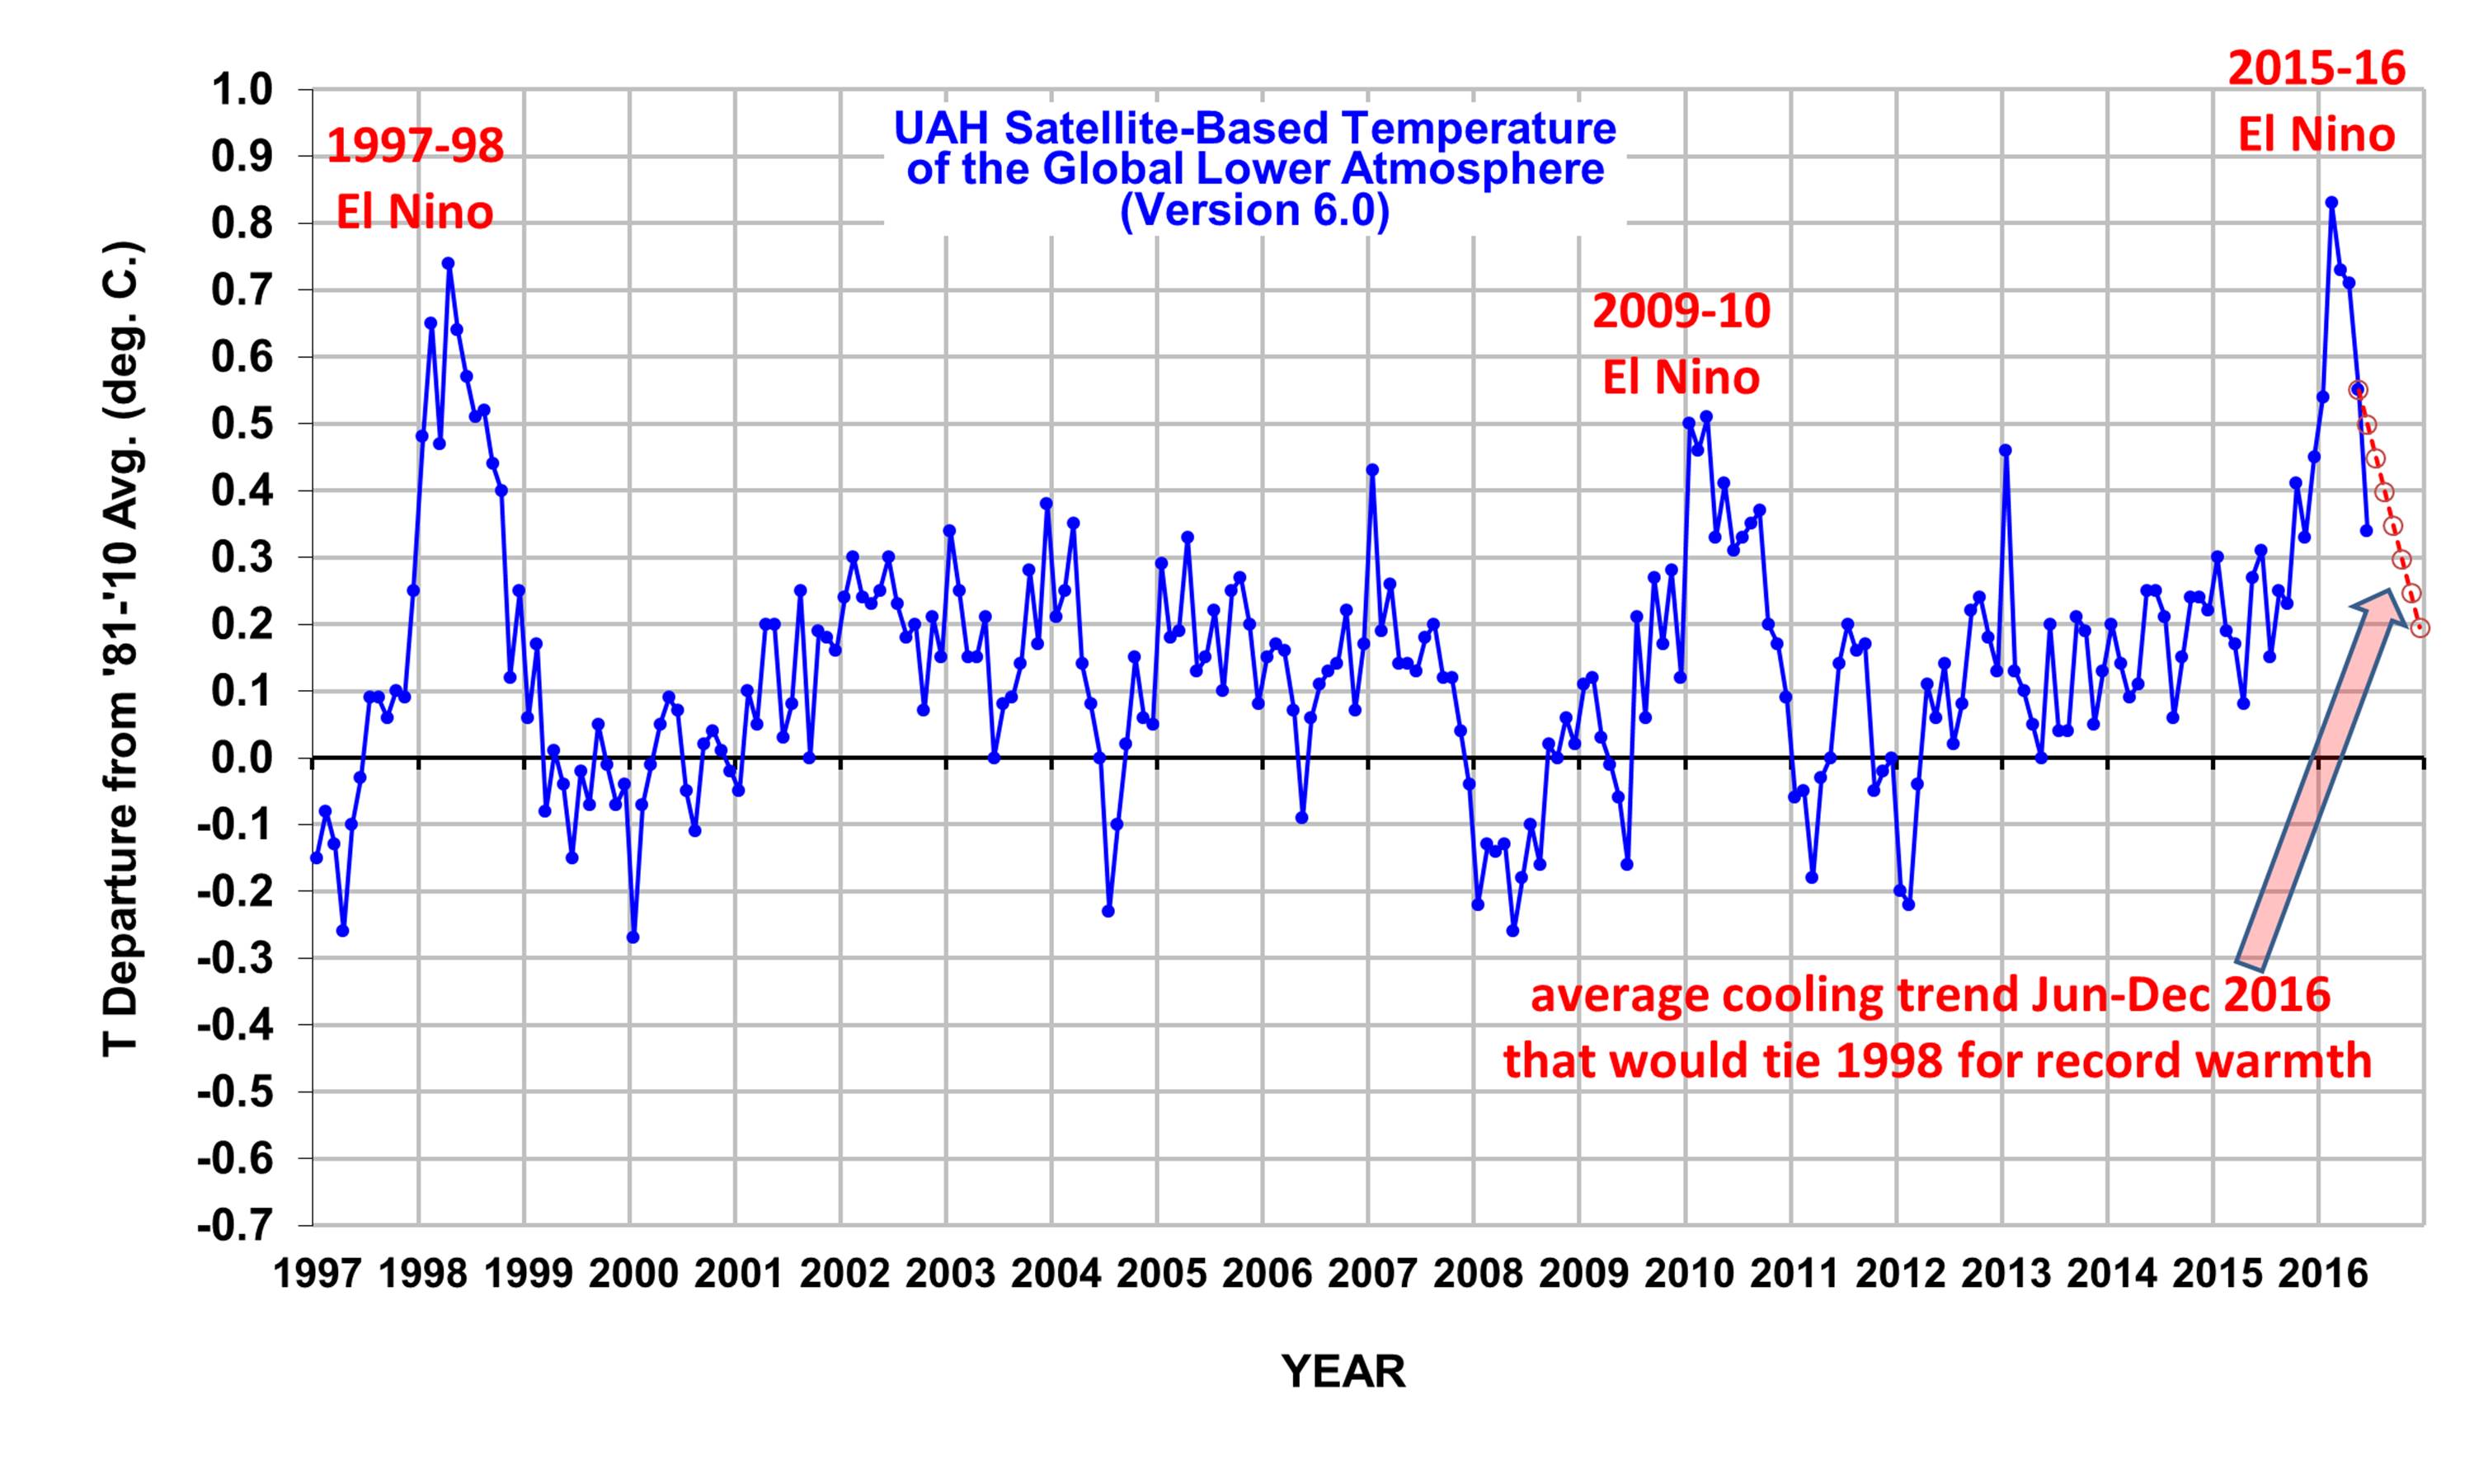
The June anomaly is well below the dashed red line which represents the average cooling rate required for the rest of 2016 to tie 1998 as the warmest year in the satellite record. So far my prediction that 2016 will end up being a new record warm year is not shaping up too well…the cooling we are seeing in the troposphere really is spectacular. Just remember, the temperature anomaly can also temporarily rebound for a month, as it did in late 1998.
The “official” UAH global image for June, 2016 should be available in the next several days here.
http://www.drroyspencer.com/2016/07/uah-global-temperature-update-for-june-2016-0-34-deg-c/
To put the numbers into some sort of perspective, the 10-year average temperature anomaly is 0.16C.
With most models predicting La Nina conditions by the autumn, we can expect temperatures to tumble a lot further by the end of the year.

http://www.cpc.ncep.noaa.gov/products/analysis_monitoring/enso_advisory/
Trackbacks
Comments are closed.

It might be worth adding that NOAA reported the global May temperatures at 15.67*C… 0.87°C above their 20th century average. This is identical to what they reported for May of 2015. The 2016 monthly warming up to then stopped.
fake science cost us BILLIONS
Predictions.
1. If UAH does not show record temperatures for 2016, it will be ignored in favour of GISSTEMP which will.
2. If UAH does show record temperatures for 2016, it will be back in favour as a temperature record alongside the surface temperature averages.
Sad- you gotta show increasing temps or you are cut out… even when there is a decline in world-wide temps.
Now the motive for the climate-gate “hide the decline” hacked emails makes sense.
The preliminary GFS based global temperature anomaly estimates also showed a large 2-month drop of -0.33C from UM CCI and -0.27C from WxBELL for April to June 2016. The preliminary UM CCI global surface temperature anomaly estimate referenced to 1981-2010 is +0.23C, down from +0.42C in May and sharply down from the peak of 0.72C in February. I posted a graph comparing the monthly estimates from UM CCI, WxBELL, and UAH for 2014 through June 2016 here:
https://oz4caster.wordpress.com/2016/07/01/global-temperature-july-2016-preliminary-update/
The GFS/CFSR surface temperature anomaly estimates seem to track the TLT estimates better than the GHCN based estimates since 2014. It will be interesting to see how the GHCN based estimates compare for June.
“It will be interesting…”
No, it won’t.
Eighteen years since the last big El Nino, and all we have is more of the same!
All about El Nino/La Nina. How about some comparisons with solar activity (sunspot numbers)? Also, don’t those satellites measure cloud cover?
Yes why do we not see any reference to sun spot activity and temp.
Joe Bastardi of weatherbell.com has been predicting this drop for several months. Historically, the temperature records hedisplays clearly show dramatic temperature drops after a strong El Nino, like we just had, transitions to a La Nina. (Of course this can’t be true since the entire climate is controlled by CO2.)
Actually, the biggest rise was in 1997. The big drop began in 1998, occurred in 1999 and negative anomalies lasted through 2000 and into mid 2001, if not later?
http://www.cpc.ncep.noaa.gov/products/analysis_monitoring/ensostuff/ensoyears.shtml
Reblogged this on Climatism and commented:
The current ~20 year global warming / climate change “hiatus/pause” set to continue (post El Niño), despite record and increasing CO2 emissions!
Global Warming theory check?
Reblogged this on Tallbloke's Talkshop and commented:
We’re supposed to believe that CO2 levels determine global temperature, but here in plain sight is obvious evidence that they don’t.
Reblogged this on Climate Collections and commented:
Paul Homewood’s thoughts on Dr. Roy Spencer’s latest post on the precipitous drop in UAH’s lower tropospheric temps.
Big Drop In June Temperatures According To UAH
Maybe in July too
Impossible…it doesn’t fit the science-deniers’ personally lucrative narrative.
Even if it were possible, you’ll be persecuted and eventually prosecuted for admitting it.
Fools think they can control nature. Fake science has wasted Billions and Billions.
fake science cost us Billions. No one can control nature.
Bub but global warming.
Climatology is akin to Astrology, the only difference being Astrological predictions are infinitely more accurate.
Thats right willy. When you look at their natal charts, Climatologists have a lot of conjunctions with their Anus.
Has anyone thought of doing ARIMA analyses as a standard part of analyzing these meteorological time series? ARIMA is the gold standard for analyzing time series data. I’ve seen two analyses of temperature time series done using ARIMA and both find that that the underlying stationary series is a random walk, i.e., that there has been no statistically significant trend in temperature variations, probably over the last fifty years. Quite honestly, as someone with some familiarity with modern statistics, I get the sense that most meteorologists and climatologists are sadly lacking a knowledge of modern statistical techniques.
Reblogged this on 4timesayear's Blog.
According to the American Meteorological Society and the Union of Concerned Scientists the globe is warming and has been for decades with 2014 being the warmest year on record measured globally as was the year before that as well as the year after that. Utah may experienced a drop in temperature because of the controlled cooling of the Eastern half of the U.S. by the Geo-engineers as the West bakes. NOAA world maps prove this is going on as record heat is observed in many places in the world as ice nucleated cold air is guided to desired areas to give the impression of global cooling. Man can control the weather and is doing it; has been since at least the Vietnam War. He cannot control the destruction he is causing but he can control the weather until all is destroyed. If someplace in Utah experienced a temporary cooling anomaly then praise God, I would love one also.However, the globe overall seems to be rising.
***SNIP***
[Take your childish insults elsewhere, and come back when you actually have some facts to debate.]