Understanding The Sea Level Rise Scare
By Paul Homewood
According to the IPCC, sea level rise is accelerating:
https://www.ipcc.ch/report/ar6/wg1/#FullReport
In reality, the fastest rate of rise was between 1920 and 1950. Sea level rise slowed down in the 1960s and 70s as the world cooled down, before picking up again:
Quoting an increase between 2006 and 2018 is simple cherry picking. Sea level rise always picks up during El Ninos. If we take the change between 2005 and 2020, it is not 3.7mm but 3.5mm/yr, statistically no different to the 1993-2020 rate, but this includes a glacial isostatic adjustment (GIA) of 0.3mm – this accounts for the fact that ocean basins have been getting slightly larger since the end of the ice age. This means that the actual SEA LEVEL rise is only 3.2mm a year:
https://sealevel.nasa.gov/understanding-sea-level/key-indicators/global-mean-sea-level
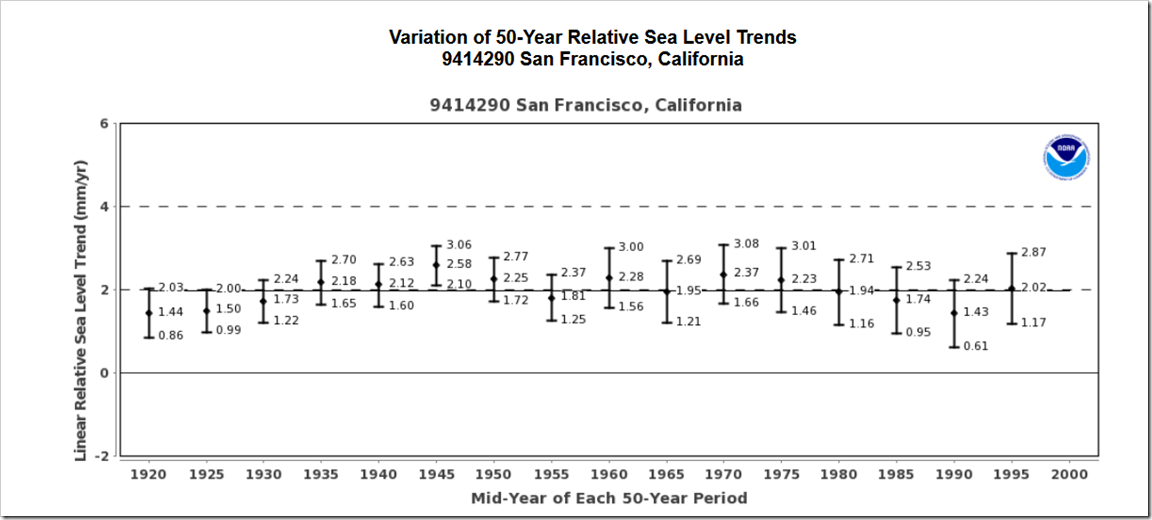
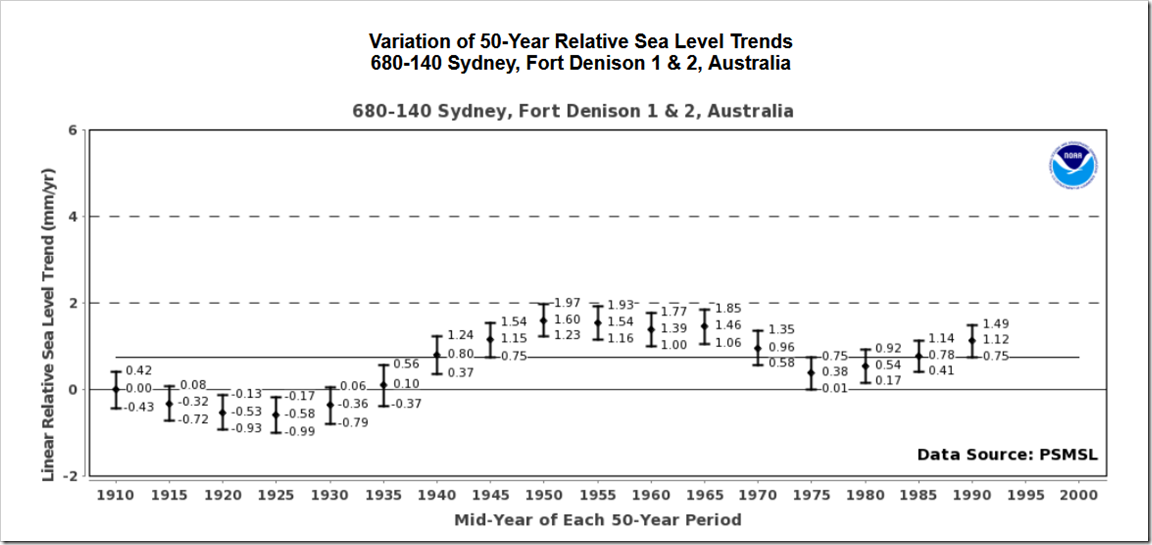
We can see from tidal gauges that the recent rate of rise is similar to the late 19thC and early 20thC. The slowdown after 1960 is also marked:
Meanwhile we are expected to believe that sea level rise is about to take off into the stratosphere!
Comments are closed.


The data on sea level around the world shows that there is no human inhabited location that has been inundated that was not undergoing subsidence. Bangladesh and the US Gulf coast are two. There are Pacific atolls that are actually higher than they were 60-70 years ago…
Sea level rise?
http://na.unep.net/geas/getUNEPPageWithArticleIDScript.php?article_id=56
“Another study related to sea-level rise (Webb and Kench 2010) appears to contradict the general anticipation that the impacts of climate change will eventually make low-lying reef islands unable to support human occupation. It uses aerial and satellite images taken over the past 60 years, a time during which there is evidence that sea levels have risen, to compare the landform dynamics of 27 atoll islands in the central Pacific Ocean. The study found that as a whole, instead of declining, the islands grew in land area by a total of 63 ha or seven percent. The research findings show that although sea level in the central Pacific Ocean rose by about 2.0 mm/yr over the study period and that all 27 islands changed physically during that time, there is considerable variation in the amount and style of change between and among the islands, with an overall net increase in land area; 86 percent of the islands remained relatively stable or their outline or shape increased in size. Twelve of the 27 islands increased in size by more than three percent but only four islands reduced in area by more than three percent.”
2.0 mm/yr for 60 years… 4.75 inches.
I believe this study was actually mentioned in an earlier IPCC report, but the emphasis was placed on the few that were lower.
Ford and Kench have similar results in more recent research -2020
https://www.auckland.ac.nz/en/news/2020/11/30/low-lying-pacific-island-has-more-land-above-sea-level-than-in-1.html
Pretending there ‘could’ be 2 metres of sea level rise in the next 79 years is as an outright lie.
The fact IPCC even mention such a ridiculous figure reveals all we need to know about the IPCC and by extension, this AR6 ‘report’.
3mm per year would take 666 years to reach 2 metres.
Annual rise rates would have to leap from 3mm to over 25mm – an overnight increase of over over 800%, and stay at that level for the next 79 years. Literally impossible. Shameful propaganda.
I would like to see a table with tide guages up to present and the satellite measurements added in to show a hockey stick on top of reality. Tide guages were average 2 mm/year whereas satellites are 3mm+ plus/minus 0.4 mm. If I remember correctly the uncertainty is in centimeters and adjustments got that down to 0.4mm. There is plenty of scope for adjustments to gradually get sea levels to raise sharply in the ‘virtual world’ that is called climate science.
When the Suez and Panama canal burst their banks, I may believe this brainwash.
I had some fun with this one:
Great minds think alike: Willis E has a good post up on WUWT covering this – especially the extraordinary acceleration required to meet the predictions for this decade.
‘Human influence was very likely the main driver’
An appeal to ignorance. They don’t know what caused it. So it must be Man.
The volume of the ocean basin is not known. It is known that it is not fixed. It is known that major activities are changing the volume. E.g., vulcanism on the 40,000 mid-ocean ridge.
We can’t measure the basin. We can’t measure the changes. Attributing changes in sea level to Man is a preposterous leap.
To reach the “intermediate” forecasts of 1-2m SL rise by 2100 then sea level rise would have to increase in rate by 3-4% per year, every year. This is clearly not the trend at present.
How about the great climate change champion Obama buying a $15M property next to the sea on Martha’s Vineyard.
Why would the rate nearly double like that? It’s just nonsense. If you are going to claim an extraordinary change in the rate of something, you had better have extremely good evidence as to why.
IPCC – AR5 – on global sea level rise
It is very likely that the mean rate of global averaged sea level rise was 1.7 [1.5 to 1.9] mm/yr between 1901 and 2010 and 3.2 [2.8 to 3.6] mm/yr between 1993 and 2010. Tide gauge and satellite altimeter data are consistent regarding the higher rate during the latter period. It is likely that similarly high rates occurred between 1920 and 1950.
So sea-level rise went from 1/5 of SFA to 2/5 of SFA in over 100 years? That’s scary!
On a very practical level if sea levels were rising significantly AND permanently this would be reflected in changes of datum used by the Hydrographic Office when creating charts of the sea bed for navigational purposes. It hasn’t happened yet!