Leconfield’s Solar Farm
By Paul Homewood

https://www.metoffice.gov.uk/research/climate/maps-and-data/uk-synoptic-and-climate-stations
The Met Office has two weather stations in the Hull area – Leconfield and Hull East Park, Class 3 and 5 respectively. The nearest station to the north is Bridlington, about 30 miles away, and itself a Class 4 site. As we know, Hull East Park is the utterly inappropriate site at the Animal Education Centre.
Hull East has only been opened since 2011, and it appears that Leconfield only has continuous data since that year as well. (More on this later, but it is absolutely disgraceful that the Met Office don’t make all of their weather station data publicly and readily available – year of opening is just one piece of data not available.)
Leconfield is an ex RAF base about eight miles away. One reader has pointed out that Hull East tends to run about 0.5C hotter than Leconfield, but this gap seems to have noticeably shrunk in the last couple of years. This is probably because the weather station at Leconfield is now just meters away from a large solar farm, only built in 2021:

.

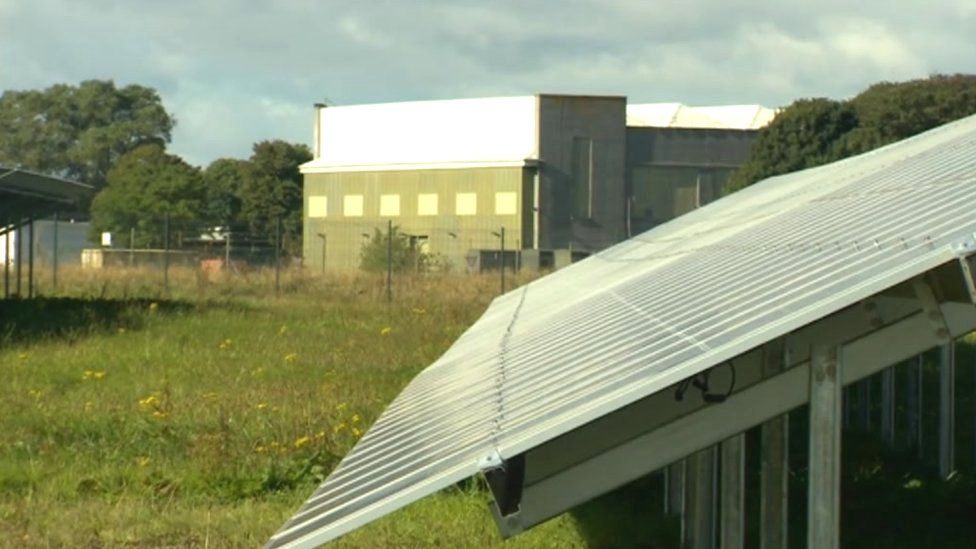
The British Army has opened its first solar farm to power one of its training bases in East Yorkshire.
The four-hectare Defence School of Transport (DST) site, in Leconfield, has more than 4,000 solar panels and is the first of four pilots.
https://www.bbc.co.uk/news/uk-england-58742833
And so the Met Office’s temperature trends get another nudge upwards!

Global warming/climate change is definitely ‘man made’!
Odds are, that is an out-and-out lie. From the photos, there appears to be no connection whatsoever between the solar panels and the base.
Without a technical explanation of how the solar generated electricity is integrated into the base supply, there is no reason to believe them.
Your military has money to burn on vanity projects.
Weasel. Solar is supplemental; it gets you no closer to ‘net-zero’ (sic). The general has lost the plot. Net Zero and sustainability are not the military’s mission. Their job is to hurt people and break things as needed. The general should be retired; he’s not serious. He doesn’t think protecting Britain is his job.
“Each solar panel will generate 550 watts“
Rubbish!
The panels will be lucky to generate 30% of that over a year.
Are we to assume that our Army only needs any training during sunny, Summer days? What do they do December – February?
Another reason why the last war we fought seemingly successfully was the one against rebels in 1991 Sierra Leone? (Still, more recent than the Yank’s successful invasion of Grenada in 1983).
Goat herders with fertiliser are still the ones to watch. We couldn’t even give our brave but ill-led troops in Afghanistan and Iraq vehicles with a reasonable chance of surviving an IED attack, even though the Rhodesian Selous Scouts had worked that problem out in the late 1970s.
What annoys me most is that it does not have to be like this. Yesterday’s regional high for the North West region was at Class 1 site “Rostherne Number 2” which was installed 31st October 2012. Then again it rarely reaches dizzy heights and was only 19.0 °C yesterday.
This is what a reasonably good site should look like in aerial view
https://www.google.co.uk/maps/place/53%C2%B021'36.1%22N+2%C2%B022'55.5%22W/@53.3602196,-2.3819409,324m/data=!3m1!1e3!4m4!3m3!8m2!3d53.36003!4d-2.38207?entry=ttu
Yes the M6 is fairly nearby but not so close as to make much difference.
In street view it looks like this
https://www.google.co.uk/maps/@53.3602196,-2.3819409,3a,75y,192.45h,87.12t/data=!3m7!1e1!3m5!1scT-F2RfwlRzdYAvBxIR3uw!2e0!6shttps:%2F%2Fstreetviewpixels-pa.googleapis.com%2Fv1%2Fthumbnail%3Fpanoid%3DcT-F2RfwlRzdYAvBxIR3uw%26cb_client%3Dmaps_sv.tactile.gps%26w%3D203%26h%3D100%26yaw%3D319.0192%26pitch%3D0%26thumbfov%3D100!7i16384!8i8192?coh=205409&entry=ttu
Why can’t the Met Office simply only use sites of this quality?
Sorry it’s the M56 (obviously not M6) and is a tad over 200m away.
I’d guess that the Met Office doesn’t publish statistics (records and trends) derived solely from Class 1 (or Classes 1 and 2) sites. From what you’ve found, would it be possible for an independent enquirer, using published data or via FOI, to obtain the data for such an analysis?
If so, it should be possible to assess whether the sets of higher and lower grade stations differ significantly from each other and if any such difference is systematic.
I have actually tried that but it would be a mammoth task and could be quite futile. If you see my other post below the Met Office data is very hard to isolate to just one site. As I detail Leconfield has had an operating site at at least 3 distinctly separate locations. Getting down to directly comparable data is incredibly difficult.
The obvious answer is that by using decent sites they will not be fulfilling their job of proving that global warming is real and failing to support the IPCC in its role as an activist organisation.
In light of what you say about site changes and movements and the consequent difficulties in establishing consistent site histories, do you know how the Met Office does so?
Just hunch but they probably don’t make much of an effort.
Paul,
I can’t thank you enough for the invaluable work you and Ray are carrying out here. The corruption of Met Office data is a disgrace, and is so important that it almost deserves a website of its own. Please keep up the good work.
I would like to second that.
I guess I’ll have to be third (no change from my school days).
Interestingly the Met Office claim there has been a weather station at Leconfield since 1959….BUT …..what’s in a name? There have been 3 separately numbered different weather stations there
“All stations that are part of the climate network have a 4-figure DCNN (district county number). In general, if a station moves more than 800m in a region of homogeneous terrain it is allocated a new DCNN, while a lesser distance will justify a new DCNN only if it is considered that the exposure at the new site is sufficiently different to affect the measured climatology.”
https://artefacts.ceda.ac.uk/badc_datadocs/ukmo-midas/ukmo_guide.html
Leconfield is variously DCNN 2362, 2363 and 2364 over the years indicating it has moved at least twice and over considerable distance. The latest incarnation appears to be from sometime around 2011 but it is diffcult to exactly pinpoint the last move.
This is one of the reasons why a long term recreation of temperature over the years using Met Office data is so difficult – you may think the data is comparative by name but can be from wholly different sites at different periods.
There are in fact some sites with two separate DCNN numbered sites (most notably at airfields) simultaneously reporting. I shall continue in reply to myself to avoid too many links delaying the post.
Over on Tallbloke’s blog the late Tim Channon did extensive work on Met office locations.
One particularly interesting revelation was RAF Wittering.
Tim estimated Class 3 but the Met Office claims it is class 1. Tim, however, did not get it wrong – at that time there were (and it appears still are ) two fully functioning separate recording sites (DCNN 4396 and 4398) below is the “other” site to the one Tim identified (hopefully in view as well.)
https://www.google.co.uk/maps/place/52%C2%B036'43.0%22N+0%C2%B028'04.7%22W/@52.6115072,-0.4655583,330m/data=!3m1!1e3!4m4!3m3!8m2!3d52.6119486!4d-0.4679669?entry=ttu
Quite how they claim the second site is Class 1 I find rather a stretch of the imagination. However it is almost impossible to ascertain which site’s figures are being reported. This is actually quite significant as the Met Office used data from Wittering to justify the record high readings of 19th July 2022 being from a high quality site!
Whichever way you cut it, the Met office really don’t seem to do themselves any favours, hide basic data behind a wall of secrecy and do disservice to meteorology.
Many years ago I was fitting some comunication equipement on the outside of a control tower of a frontline RAF base when there was a “Rat Scramble ” ,[ Russian plane spotted ], and 2 jets took off under high performance . Half the runway then straight up .
From where I was , about 100 odd yards away , the heat and jet blast was quite enormous .
So how anybody can justify temp readings from an in use airfield is just completely wrong . But that is probably what they want to claim their ” Hottest Ever “.
The current site is there in the image dated 12/31/2002. No land disturbance noted, so not new.
As far as I can ascertain, John, both sites are quite long established. One site dates from 1955 and the other from around 1972. There are also two World Meteorological Organisation designations being WMO03461 and WMO03642.
Which one is which though is the hard bit to identify. The Met Office only use the name “Wittering” for one site and only has one CIMO assessed. The tricky thing is which one’s data is being used or more likely are they mixing and matching the two depending on which result they are trying to acheive.
This multiple stations per site is not unusual particularly for aviation sites..
And yet, from such dubious data and site locations, they know EXACTLY the climate, or the weather (it’s not clear which) in 50 or 100 years time if we don’t obey.
From that overhead map it would seem that reflected sunlight from the solar farm would be heating the area all around the weather station . Mostly in the morning when the sun is coming up from the East .
Most people realise how hot the sunlight can , a noticeable difference when you move into the shade , but do not realise that reflected sunlight can make the same place a lot hotter . A building in London which had windows in a curved front was setting fire to things in the street when the sun was in a certain direction .
So any weather station near to a solar farm , or anything with a lot of windows , is very likely to have temp readings a lot higher than normal .
Perhaps that is why they do it .
Sorry to hog the comments here and hope I don’t rack too many people off!
What I find so absurd is that the Met Office must know of issues like this at sites like Leconfield. They claim to regularly inspect everywhere and they can’t be blind to have driven there! So do they simply not care or is the inference that they want any ever increasing number of artificially warmed sites actually true?
Below is the google aerial view of one of their flagship Class 2 sites at Bedford.
Zoom into the red kite marker to get a close up. Anyone care to count those things that seemingly make no difference at all to the site readings!
https://www.google.co.uk/maps/place/52%C2%B013'37.1%22N+0%C2%B027'55.7%22W/@52.2269666,-0.535702,21303m/data=!3m1!1e3!4m4!3m3!8m2!3d52.226965!4d-0.465471?entry=ttu
The Met Office’ mission creep into the climate change business has corrupted them. They are not fit for meteorological purposes.
Hence, they should be defunded, plowed under and salted over, with a new national weather service formed. First sentence of new weather service mission:
“We do weather. Not climate.”
Any mention of climate should be a discharge offense.
Ray
As far as I’m concerned on threads where Met Office/BBC claims of record whatever are concerned you can make as many comments as you need to. Knowledge is everything.
I have been following the Post Office Horizon inquiry most days it’s on. The parallels between the two might surprise a lot of the public.
Oh are they brand new Vauxhall’s waiting for a life, or is it just one super massive car park? Either way it looks a bit fishy…
After further review, I don’t see the solar panels as being a problem. The 50 foot wide strip of tarmac on the southwest side of the plot is going to screw it over, anyway.
I assume the prevailing wind there will keep the solar panel heat off the thermometer most of the time. Such that the effect will be occasional – a few days a year – of extreme high temperatures recorded, when the wind shifts east -to-west.
Although, as you say, the prevailing wind might mean that the averaged effect might be slight, “occasional days of extreme high temperature” would likely be recorded as record highs. This seems to be a risk at any site to which a nearby heat source has been added; obviously such distortions will be in one direction only.
Right. Record temps could indicate a change in the wind, NOT the temperature!
Do you happen to know how long a temperature has to persist to count as a “record high”?
Sorry, no.
That is a very good point and the answer is actually quite complex. In simple terms the duration of the high could literally be milliseconds. If it happens and the measuring device records it, then it counts.
However, this is where the type of recording apparatus comes in and that has significantly changed over time – especially recently.
Traditionally temperatures were recorded using alcohol/mercury devices termed “Liquid In Glass” (LIG). These are very accurate but relatively quite slow to respond to temperature changes. Obviously these typically require a human operator to record the details and were historically a design known as a “Six’s” thermometer – you probably have one.
https://en.wikipedia.org/wiki/Six%27s_thermometer#:~:text=Six's%20maximum%20and%20minimum%20thermometer,instance%20in%20meteorology%20and%20horticulture.
In order to automate the data collection process these were superseded by devices that measure temperature by electrical resistance changes in materials and are known as ERT’s, or more specifically in the Met Office case as PRTs – Platinum Resistance Thermometers. These devices respond much more rapidly than LIGs hence will record sudden temperature changes of either natural or, more likely, artificial origin.
This change from manual to automatic reporting required the latter to have reliable electricity and data comms to work. These requirements were not easily met in rural locations thus a large swathe of more representative rural sites were closed down. The remaining sites were then largely either urban sites, airfields, water and sewage treatment sites, botanical garden sites/affluent walled gardens often in stately homes, research centres and lots of other untypical locations.
150 years ago there were about 15 simultaneously recording sites in my home county of Kent alone. 100 years ago this number had increased to over 25. 50 years ago (1974) there were over 35. Now in 2024 there are just 7 of which only 2 rate as Class 1 ( an airfield and a horticultural research centre.) The other 5 are between poor and rubbish sites. From the 70s impending ice age scare onwards good quality rural sites closed rapidly. Most new sites (as has been highlighted by Paul) as poor to crap such as Neatishead Class 4 opened in December 2022 under the shadow of a huge Radar dome! and of course they all have thermometers that will respond much more rapidly.
Here is a video taken at the site of the 2022 UK record high. Watch it through carefully and you can see the Met Office site through the heat haze!
Should have added this link.
https://dailysceptic.org/2023/06/28/exclusive-three-typhoon-jets-landed-next-to-measuring-device-when-britains-record-temperature-of-40-3c-was-recorded/
Does any serious meteorological organisation actually think high performance jets taking off and landing would have no effect? Taking the piss or what!
When I worked in electronic test whenever anything was changed, upgraded or repaired then it was either run in parallel or tested against standards with known parameters to ensure that the performance of the tests remained the same.
Does the Met Office do anything similar?
An amusing hypothesis: rather than solar panels causing higher temperatures, it may be the reverse, higher temperatures came first, caused by higher sunshine, which then attracted the solar panels.
What is needed is data from a station that does not move, but gets a solar farm built next to it, how big is the rise in temperatures?
The now solar site had roads and buildings (?) in Sept 2018. [Google has messed-up with a miss-dated image, but…] on Aug 2019, the land is cleared of both roads and structures. {I use Google Earth Pro}
June, 2021, the site has scars from traffic, items on the edges, and the addition of 5 black rectangles (?) with a long side of 3 meters.
This one [ 53.876035, -0.440053 ] has multiple tracks around it. Near it is a white thing and just to the left of that is a line of disturbed soil going, mostly, south. A kink takes it to the far south end of the solar panels, in place as of March 2023. The 5 black things are now gone.
My guess: underground cables to carry the electrons. Also, I do not see electric lines/poles anywhere in in the local area.
John, there is actually a substation surrounded by the semi circular road to the middle side of the solar panels. As its a former airbase cabling is underground as far as possible – don’t want aircraft colliding with pylons!
In the UK we are paranoid about security so infrastructure maps are not allowed to indicate much detail but this map indicates the sub station. The panels will likely be exporting most of the summer to get electricity bill payer funded subsidies from feed in tariffs.
https://openinframap.org/#13.77/53.87584/-0.43893
Thanks for that, and the source. I just used it to see what it had near me. Answer: Schultz Substation @ 47.121593, -120.513993 Just a brisk walk from where I live. Hydro power comes from dams on the Columbia River.
Strewth John just looked up the weather extremes for Ellensburg (if that’s near you) – from 110 °F (43.3 °C) in summer to −31 °F (−35.0 °C) in winter.
You must think us Brits are a bunch of softies!
A couple of years ago the airport (KELN; 5miles sw) recorded 116°F in June and last December -17°F. At 2240 feet elevation, we cool on clear summer nights during “heat domes.”
Has anyone compared Met stations with nearby Private Weather Station? Indeed many report to the Met Office Weather Observation Website (WOW) that require classification to their standards.
The recent uptick in warmth at Leconfield in 2022 was entirely in the summer months (June, July, August), it looks like a data glitch to me, but who knows, further analysis ongoing:
It’s a pity the Met Office don’t publish all of this data, as they should, instead of having to rely on external sources
I got the daily data from the Met Office MIDAS-OPEN database, available to all (after registration). The daily data goes back to 1959, but there is no data from 1970 to 1990. They don’t provide the very useful monthly averages AFAIK, computing them for all the data requires some non-trivial programming ability.