AMO & PDO Cycles
By Paul Homewood
It is well established that both the Atlantic Multidecadal & the Pacific Decadal Oscillations affect global temperatures. According to NOAA, the AMO alternatively obscures and exaggerates global warming.
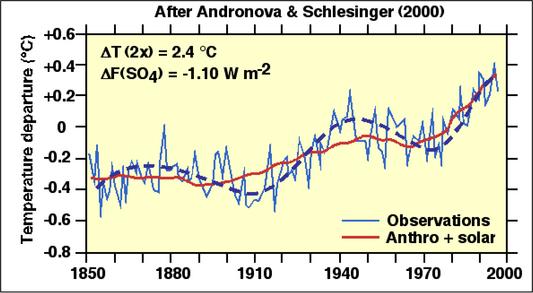
The solid blue curve shows the observed northern Hemisphere temperatures and the dashed blue curve is a smoothed version. The red curve is the temperature history for a model that responds to the external forcing of greenhouse gases and solar variability but not to natural climate variations. The blue alternations about the red curve represent the natural AMO oscillations. When the AMO decreases, as from 1950 to 1975, global warming may appear to be reversed. When the AMO increases, as from 1975 to the present, the global warming (red) is exaggerated.
And Roy Spencer tells us :
The Pacific Decadal Oscillation (PDO) is an internal switch between two slightly different circulation patterns that occurs every 30 years or so in the North Pacific Ocean. It was originally described in 1997 in the context of salmon production. It has a positive (warm) phase that tends to warm the land masses of the Northern Hemisphere, as well as a negative (cool) phase.

http://www.drroyspencer.com/global-warming-background-articles/the-pacific-decadal-oscillation/
Things get particularly interesting though, when you put the two cycles together, as below.

- In the 1930’s, both PDO and AMO warm phases come together.
- Both cold phases come together in the 1960’s and 70’s, the time of the “ice age scares”.
- And, the warm phases come together again for about 10 years from the mid 1990’s, when we saw the last spike in temperatures.
The PDO has now turned cold, and, with the AMO still in its warm phase, temperatures are flatlining.
It is likely that the AMO will remain in warm mode for another 10 years or so, but by the mid 2020’s we are likely to see both great ocean patterns stuck together in their cold phases well into the 2030’s.
When they do, will we see a similar drop in global temperatures such as we did in the 1970’s? I would not bet against it.

http://www.newclimatemodel.com/the-real-link-between-solar-energy-ocean-cycles-and-global-temperature/
“Before it is safe to attribute a global warming or a global cooling effect to any other factor (CO2 in particular) it is necessary to disentangle the simultaneous overlapping positive and negative effects of solar variation, PDO/ENSO and the other oceanic cycles. Sometimes they work in unison, sometimes they work against each other and until a formula has been developed to work in a majority of situations all our guesses about climate change must come to nought.
May 21, 2008
@ “….it is necessary to disentangle the simultaneous overlapping positive and negative effects of solar variation, PDO/ENSO and the other oceanic cycles. “
Having taken notice of the reference paper May 21, 2008, and the mentioned cooling period from “(1940 to 1975)”,
here is a PPT presentation: http://climate-ocean.com/images/Lect/_6_EN.pdf that puts the emphasis – during the time period 1940 to 1975 – quite differently – namely anthropogenic activities at sea during World War II. There are numerous events during WWI and WWII, which can be linked to naval warfare, explained in further six PPT (right column) at: http://climate-ocean.com/ .
Whatever volume of “Solar Energy“ reach earth, the climatic result is determined by the oceans, their interior processes, their status, and their interaction with the atmosphere. That is reflected in what was expressed in a Letter to the Editor, NATURE 1992, “Climate Change”, Vol. 360, p. 292; http://www.whatisclimate.com/1992-nature.html :
“ ‘Climate should have been defined as ‘the continuation of the oceans by other means’.”
The reference to ‘PDO/ENSO and the other oceanic cycles’ is appreciated.
Hi ArnB
I seem to recall having previously used your excellent quote:
‘Climate should have been defined as ‘the continuation of the oceans by other means’
(duly credited to you).
Can’t agree on the effect of WW2 though but we are all free to raise and test our own ideas when the established climatologists don’t have a clue 🙂
Hi Stephen Wilde!
Well said: “when the established climatologists don’t have a clue”!
That applies particularly for the three extreme war winter 1939/40, 1940/41 & 1941/42, for which I can currently offer only b/w images, for example
___Tallinn, winter T°C, 1880 – ca. 2010 http://www.seaclimate.com/e/e3/images/buch/big/e3-6.png , and
___Sweden, T°C January-March 1900-2000; http://www.seaclimate.com/e/e2/images/buch/big/e2-1.png ,
with plenty more graphics (most in color) in the mentioned PPT-presentations, see above!
Many thanks for your kind reference to : How climate should be defined.
Flatlining is good. It will drive the IPCC crazy, without subjecting the world to actual cooling.
PS;
So all we have to do is learn to manipulate AMO and PDO timings so that they’re always out of phase!
Apart from AMO/PDO simultaneously going negative, we must factor in the effects of decreased solar activity during SC25 and beyond, which almost certainly will impact upon global climate to produce a cooling effect. At the least, we can expect conditions similar to the Dalton Minimum. Are we looking at a ‘perfect storm’ of natural cooling influences in the coming decades, especially for North America and Northern Europe? The NAO also looks as if it is trending negative, resulting in significantly cooler Northern Eurasian winters, with storm tracks heading further south along with the Jet Stream, allowing much colder Arctic air to penetrate Northern Latitudes. Of course, disentangling the effects of a quiet Sun upon these oceanic oscillations is in itself a difficult task and it is entirely likely that the patterns of ocean currents and atmospheric climatic oscillations are mediated by solar influences, to what extent remains unclear.
I agree that whilst a combination of AMO and PDO in cold phase will deliver cooling, a solar minimum on top should deliver still more cooling. One unknown is what the AMO and PDO were doing back in the Dalton and Maunder. We should be experiencing it from certainly 2020 onwards but perhaps before.
Reblogged this on Climate Ponderings.
So we’re now about 5 years into the cold phase of the PDO, which began towards the end of the 1st year of Solar Cycle 24, so far one of the least active in over a century.
Shouldn’t the combination of those 2 events be enough to cause global cooling?
Wait for the AMO to turn cold as well
Is the greenhouse effect of CO2 understood as the warmists claim? Is the theory proven or not? Is CO2 the dominant driver of temperature as the warmists claim? Why are their models failing? These are the questions I, and I am sure many other non-scientists, would like addressed more specifically. NASA/NOAA, most of academia, and the mainstream media argue that CO2 increases will lead to calamity. What is the truth? What is the evidence refuting the AGW theory?