Bob Ward’s Wettest Year Fails To Materialise – 2014 Only 16th Wettest
By Paul Homewood

https://uk.news.yahoo.com/warmest-warning-issued-131014113.html#gHEw1fE
You may recall headlines a couple of months ago, in the run up to Lima, about how 2014 was on course to be one of the wettest on records in the UK. The story seems to have been peddled around by our old friend, Bob Ward.
As I pointed out then, the data at the time showed that the year was unlikely to be exceptional. The Met Office have now published the numbers for the full year, which confirm what I predicted.
On the long running England & Wales Series, last year recorded 1106mm of rain, making it only the 16th wettest year since 1766. The wettest years remain 1872 and 1768, with 1285mm and 1247mm respectively.
Put another way, 2014 represented the median of the top 31 years, something like a 1 in 8 year event.
It is also worth noting that, after the wet start to the year in January and February, the rest of the year was remarkably average, only 13mm above the long term mean.

Figure 1
A look at the distribution of the wettest years, in Figure 2, is perhaps more instructive. There is evidence of clusters, but the last decade or so does not look remarkable in relation to earlier periods.

Figure 2
A decadal analysis of years with over 1000mm shows a similar picture. Since 1770, there have been 62 such years, a 1 in 4 year event. The 1990’s and 2000’s both recorded 4 years with more than 1000mm, which is above the long term average, but this has been a common occurrence in the long term record, which exhibits regular runs of wet and dry periods every few decades.

Figure 3
It should also be borne in mind that we are currently in the warm phase of the AMO, which NOAA tell us correlates with increased rainfall over northern Europe, so there is no reason to believe that there is anything unnatural about recent precipitation amounts in the UK.
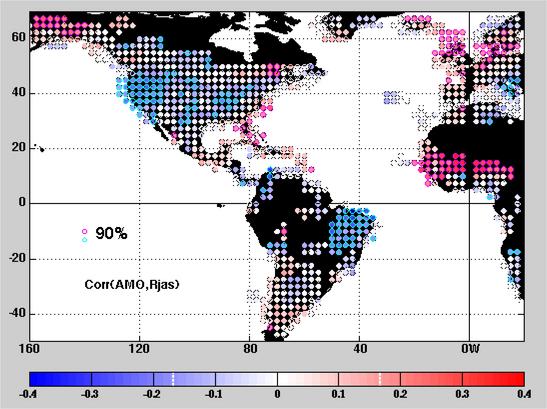
Red and blue colored dots represent positive and negative correlations of Northern Hemisphere summer rainfall with the AMO index. When the AMO is positive (warm Atlantic) there is less rainfall over most of the United States and northeastern South America, and more rainfall in southern Alaska, northern Europe, west Africa and Florida.
http://www.aoml.noaa.gov/phod/faq/faq_fig1.php
United Kingdom
Figures for the UK as a whole only go back to 1910, and show 2014 to be the 4th wettest.
Scotland and N Ireland rank 3rd and 4th wettest respectively, while on the England & Wales Series 2014 was 6th wettest since 1910. This would suggest that there is reasonable correlation between the latter and the UK Series.
Source
England & Wales Precipitation Series
http://www.metoffice.gov.uk/hadobs/hadukp/data/monthly/HadEWP_monthly_qc.txt
Comments are closed.

Why is it that the Met Office give all their data in relation “since records began in 1910,” when the CET data goes back to the 18th Century? Would I be correct in assuming that this is yet another example of cherry picking?
You don’t understand climate science, that’s your trouble.
“Since records began” has been redefined to be one year after the last time it was hotter/colder/wetter/drier/etc. than the current year.
“You may recall headlines a couple of months ago, in the run up to Lima, about how 2014 was on course to be one of the wettest on records in the UK.”
It seems the objective was simply to garner column-inches ahead of the Lima-freebie.
You seem to find worthy of comment the fact that Bob Ward’s pronouncements turn out to have no correlation with reality.
I cannot think why.
somebody has got to do it, and do it well. ” all that is necessary for evil to triumph…”etc. Nor is demonstration of falsity and error an “ad hominem”, but mark someone as a deceiver and their credibility is gone. See Bishop Hill for Lewendowsky’s latest insane attempt to portray all sceptics as mentally ill. That there are the people to call them out and the means
to do so might save our civilisation from the “madness of crowds”.
The above topic was reported in the Daily Express today,where Bob Ward is claimed to be a Weather expert.A unicorn came into my garden today,and asked for shelter,as he had escaped from the Grantham Institute,and was too scared to return.I politely suggested that he may like to join the Met.Office where he would be welcomed with open arms.
Ward is up there with such climate science “luminaries” as Cook, Lewandowsky, Oreskes,and Mooney. It is disgraceful that these green propagandists are given any credence but they have been handed a megaphone by the MSM and governments.
Fast Fingers Ward is probably right. UK 2014 could well prove to be the “wettest” evah! But it has nothing to do with rainfall.