Global Cooling, Anybody?
July 20, 2022
By Paul Homewood
Roy Spencer sums up this week’s heatwave!
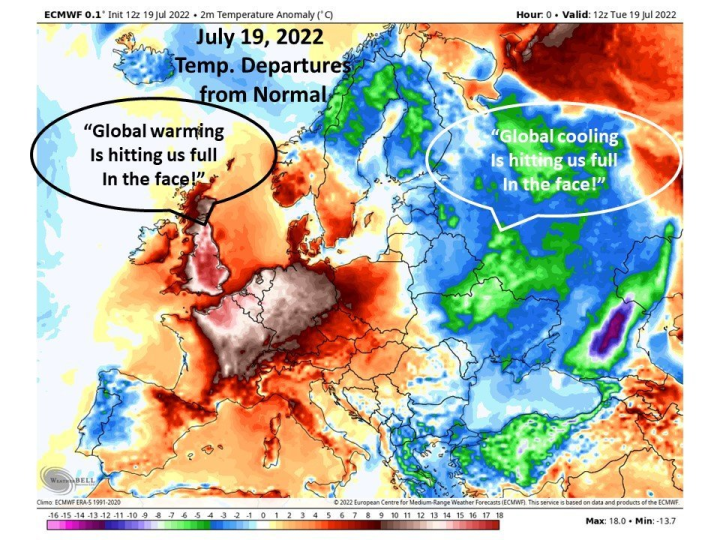
Courtesy of Dr Roy Spencer/Watt’s Up With That
22 Comments
Comments are closed.
By Paul Homewood
Roy Spencer sums up this week’s heatwave!
Courtesy of Dr Roy Spencer/Watt’s Up With That
Comments are closed.
| pardonmeforbreathing on Transatlantic air fares to jum… | |
| liardetg on Electric Van Sales In Dec… | |
| micda67 on Electric Van Sales In Dec… | |
| pardonmeforbreathing on President of European Central… | |
| glenartney on Electric Van Sales In Dec… | |
| Vernon E on Electric Van Sales In Dec… | |
| oldbrew on President of European Central… | |
| coralstrawberrydiome… on Electric Van Sales In Dec… | |
| Broadlands on John Robson’s History of… | |
| Devoncamel on Electric Van Sales In Dec… |

But but but but…..
All that blue / green / purple stuff is only weather!!!!
Nothing to worry about!
Another round of La Niña is on the cards.
It peeves me to say it; but despite my prejudices the forecasters got their model pretty nearly right. Oh all right, they were spot on.
Does that add credibilty to their 25 and 50 year models?
Weather forecasts are mainly about extrapolating current measurements forward a few days in time using bog standard equations of fluid dynamics and thermodynamics.
But so far they have declined to explain the heat, which may have involved a rare state of the jetstream.
Climate models involve mystical potions and incantataions, and a brutal suppression of dissent.
Malcolm, sadly not a lot. As climanrecon observes, the short term forecasts use standard fluid dynamics and thermodynamics. These are based on the linear equations of classical physics and their approximations.Therefore, they must diverge from physical reality with time. A full non-linear solution is beyond any feasible computational method we possess. Climate models are based on further reduction with approximation to a managable form within the capability of present super computers. ‘Reality’ is bounded by error bars. This limited mathematical approach had its genesis in the efforts of Continental mathemations at the end of the 18th C, when they abandoned any attempt to solve the problems raised by Newton in the ‘Principia’. Newton’s insisive approach was abandoned and replaced with ‘software’ – linear algebra. There has never been a physical solution based on linear algebra that could be extrapolated as a time series with absolute certainty – ask Claudius Ptolemy.
This jogged my memory! The 18 year pause in atmospheric warming, which at the time was inexplicable. If I remember correctly, satellites with Platinum Resistance Thermometers were launched into orbit. These devices could measure atmospheric temperatures at different altitudes with great accuracy.
The climate alarmists thought this would prove AGW, however atmospheric temperatures showed no temperature increase for 18 years, until they reverted to methodology using the old, inaccurate thermometers.
On a different subject, the BBC announced that a temperature in London had exceeded the previous record temperature by half a degree at London Heathrow Airport. In my view this reading is erroneous due to the heat island effect at that particular location.
I saw a chart like the one above on the BBC weather. Where there is a southerly movement of air mass, there will be a northerly somewhere. Why focus on one as something special, but ignore the other.
It was the same in the US a couple of years ago. Discussion of very hot weather in one area, ignoring the cool weather next to it. The weather chart showed both, but the cool region was not even acknowledged.
It will be interesting to see what the UAH comes up with for Europe in July. The “heat dome” could be visible if it reached high enough, plus if it doesn’t average away to nothing over the entire month.
I saw a chart too.
All-Time Cold Records Fall In Australia http://www.lavoisier.com.au
That takes me to a large PDF
are the cold records really All-Tine ? activist said 4 years
As I have said before, Arctic heatwaves, European heatwaves, heatwaves in England, Antartica – wherever, it’s all about the jetstreams. We don’t understand jetstreams very well as yet.
Well we do know from HH Lamb that the jetstream pattern changes during solar minimums and it changed as far back as 2005. Just a thought given that last night’s rain was about 0.5mm, has the change caused the long dry period for us, especially in the South East, given that our rain usually comes in from the Atlantic on SW airstreams. With a north-south jetstream are we missing these weather systems?
You can play the daily sequence of July 2022 2m temperature global anomalies here and see how it all developed.
https://climatereanalyzer.org/reanalysis/daily_maps/?dm_id=world-ced&wm_id=t2anom&year=2022
The climate change zealots will now be unbearable they will cry “we are doomed ” unless we change our ways (whatever that means) from every media outlet. Even Rowlatt looks sort of stunned and not quite sure what to do next, now the extinction event has arrived.
It is pointless trying to introduce logic because they have proof they were right.
I enjoyed the summer of 1976 because I was 24 and healthy, at age 70 with health compromised I found the afternoon of 19th July 2022 too hot and succumbed to dehydration and was quite unwell.
My sister has been on a 12 day cruise around the uk and Ireland and then on to the scilly isles yesterday, she has report cool damp drizzly conditions all week yesterday requiring the wearing of a cardigan!
The core behaviour of atmospheric structures giving rise to this sort of phenomenon is fairly well documented. We know that explosive output from solar activity – or conversely the lack of it – causes the upper atmosphere to expand and contract. This pushes and pulls on the jet stream structure and on the paths of cyclonic lows following that structure.
In quieter times, such as we have seen in recent years, surface activity is shifted towards the equator. This scoops up tropical air and pulls northern air towards the equator. Exactly as shown in the diagram.
The behaviour of the thermosphere climate index in recent months may be expected to give rise to temperature distortions that have been noted. Selective reporting by mainstream media using figures from “Urban Heat Island” locations doesn’t help.
The “Sea – Land Differential” effect adds to the twisting of the jet stream, giving the sort of behaviour pattern often reported in California, less common in Europe as the coast is not so straight a line.
The CET data for the hottest day is in, the most scientifically rigorous temperature record we have for the UK.
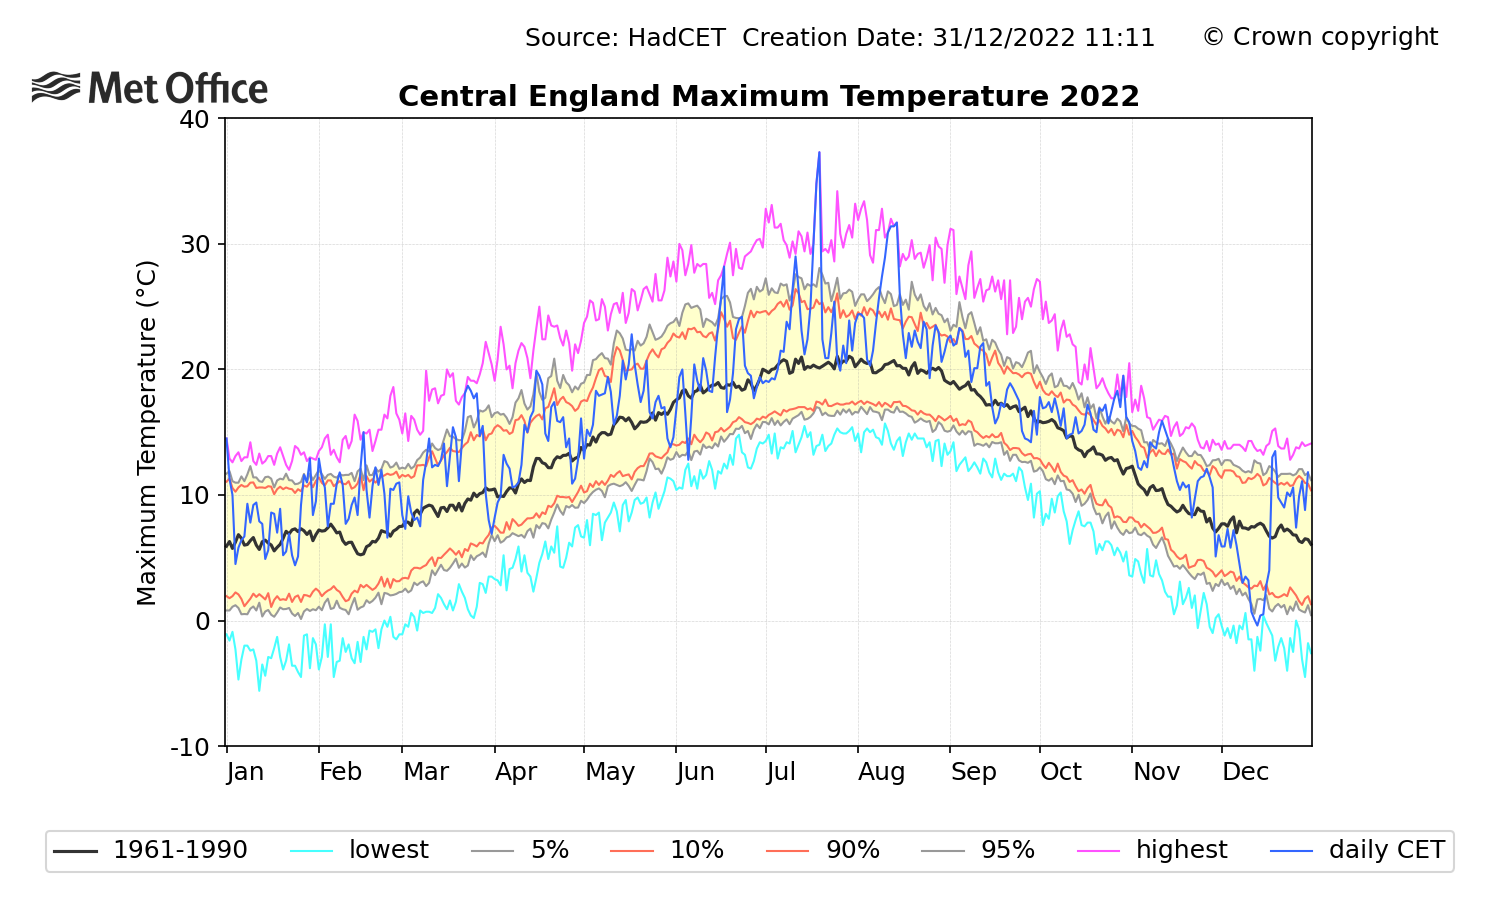
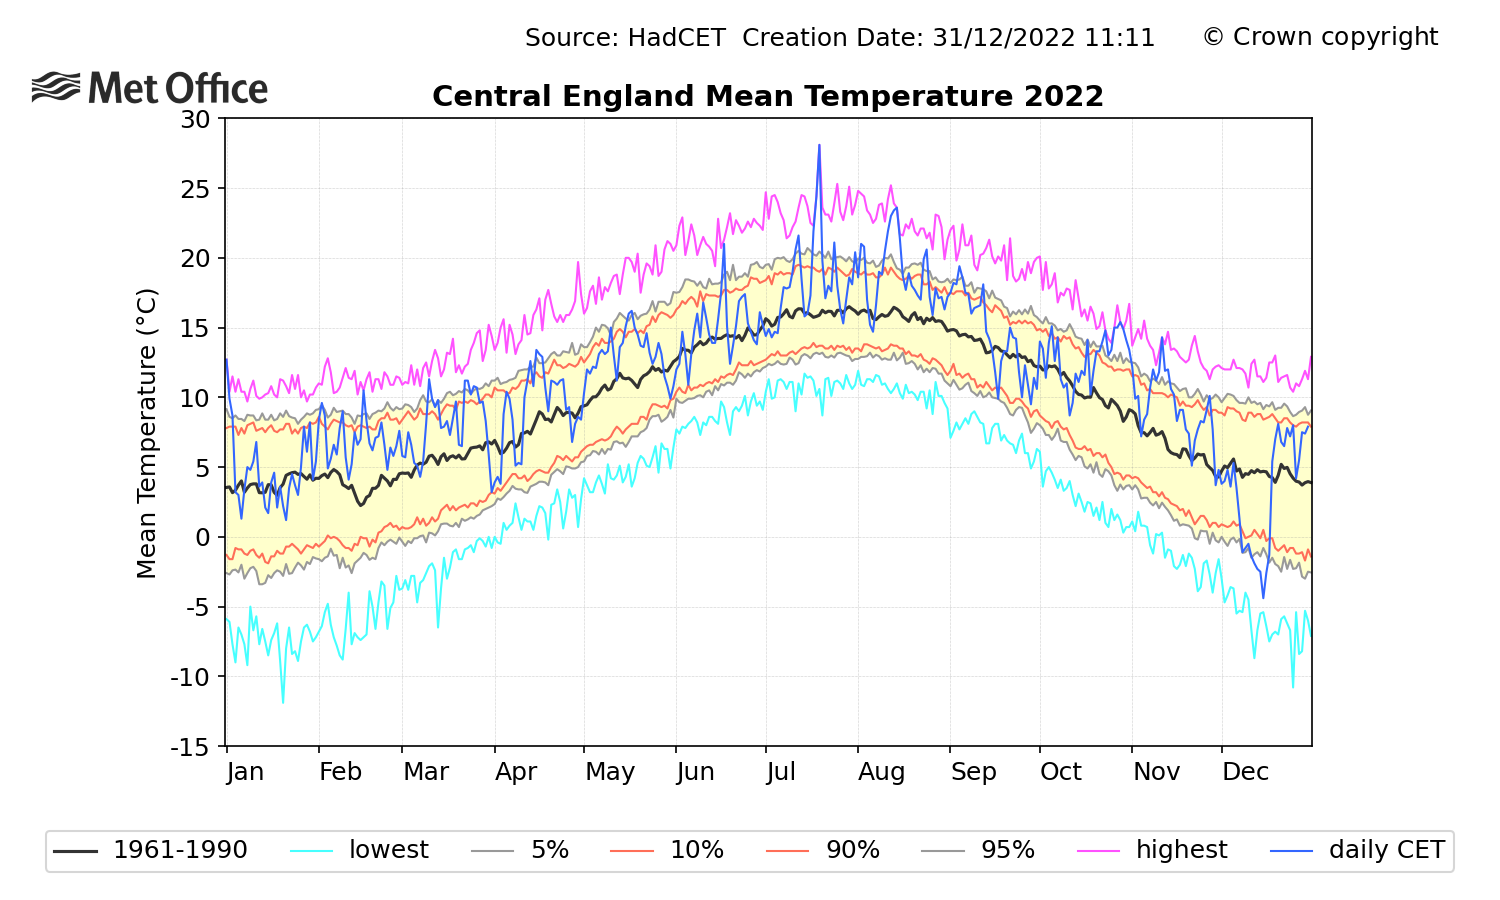
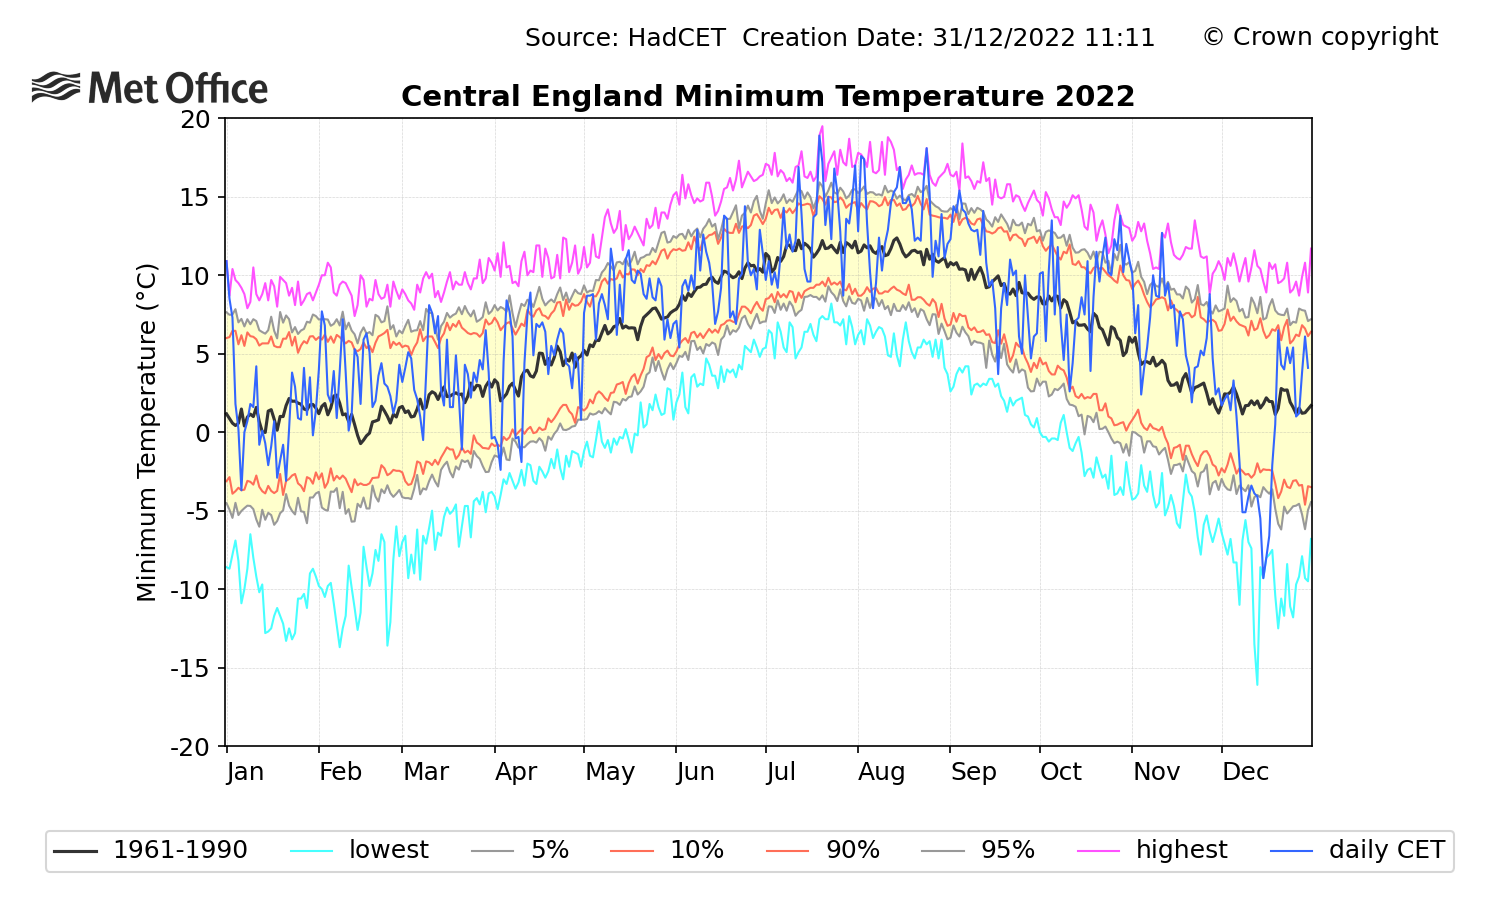
The max and mean temps were clear all time records, min not quite.
PS it reached 37.3C, someway off 40C, but then the center of the hottest air didn’t conveniently plant itself in the middle of the CET area.
Something that occurred to me is that on very hot days weather station operators may be tempted to keep checking the thermometer. The BBC was in the Cambridge Botanic gardens showing where the old record was set and they opened the Stevenson screen to show the instruments. Aside from immediately affecting the rate that the air diffuses in and out the sun immediately fell on all the instruments. This surely invalidates any reading taken that day?
Is there a daily global temperature anomoly?
Some sources attempt to provide one.
See my link above for all July 2022 days.
Current day at:
https://climatereanalyzer.org/wx/DailySummary/#t2anom
My local paper[1] cites the Met Office to “prove” that 40 C records cannot happen in an unchanging climate, and that local fires are caused by climate change rather than the oiks that set fire to fields[2]. I despair!
[1] https://www.eadt.co.uk/news/suffolk-norfolk-heatwave-fires-net-zero-9160078
[2] https://www.eadt.co.uk/news/crime/ipswich-london-road-fire-boy-15-arrested-9160334
Not many people realise that records, by definition, can only ever change in one direction, but that averages can go either way, possibly in opposition to records. For example, hypothetically, the average speed of 100 m Olympic runners might over ten years go down, but that is not incompatible with the speed record being smashed some time in that period. (Just play around on the calculator with Normal Distributions with declining means.) The obsession with record highs makes for good sales of newspapers, politicians’ sound-bites and doomsayers’ megaphones but not for good science.