EU Electricity Prices & Renewable Energy
August 1, 2015
By Paul Homewood

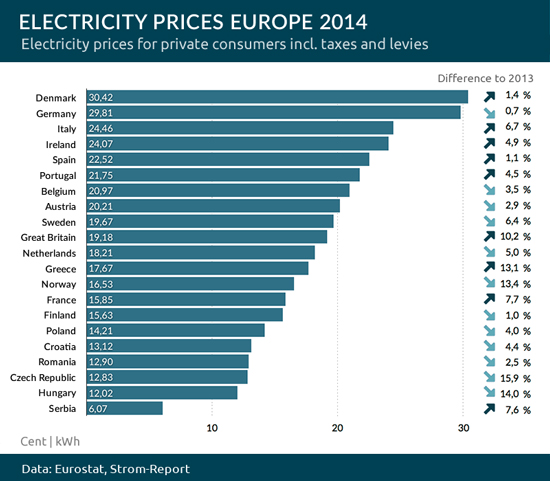
Ed Hoskins wrote an interesting essay for WUWT this week, European Renewable Energy performance for 2014 falls far short of claims, which included the above table.
Joe Public kindly sent me the Eurostat table of EU electricity prices. No prizes for spotting the connection.

https://upload.wikimedia.org/wikipedia/commons/a/a9/Electricity-prices-europe.jpg
13 Comments
Trackbacks
- Aproximadamente el 84% del exceso (y subida) del precio de tu luz se debe a la “energía verde” | PlazaMoyua.com
- Obama Finally May Succeed! | US Issues
Comments are closed.

Bookmarked!
Correlation is not causation – only kidding. We know that the subsidies paid to renewable energy generators are added to consumers bills (except in Spain where some of the subsidies are paid by the taxpayer and are not added to electricity prices) so there is a strong correlation between electricity prices and amount of renewable capacity.
The amount each Country has invested in renewables would also be interesting.
Just to see how much they have been investing (wasting) to get their very expensive electricity.
Why is hydro not concidered renewable?
In that case Norway would come as 1. in renewable instalations.
It’s the traditional way that BP have always presented it.
Because to count hydro would put many countries way above the “target” for reducing CO2 emissions and therefore not need wind and solar.
They want to force the use of wind and solar.
They only count hydro when they need to beef up there figures to show how much “renewables” they have.
Its a “moving the goalposts” thing.
So much for the ‘free’ energy from the wind and sun then. Shared on Facebook.
Combining the data from the two graphs clarifies the trend: http://tinyurl.com/qx4nzus
Jonathan Drake,
Do you have a correlation coefficient for that graph?
Billy Liar,
Yes, the R^2 = 0.85378
In Ontario, they run the generating station at Niagara Falls at far less than capacity so that wind and solar can be used. In fact, wind and solar must be used first (by law) followed by other forms of electricity generation. Do you just love ideology!