Arctic sea ice update
October 2, 2018
DMI confirm that the average Arctic sea ice extent during September was the fourth highest since 2006, and the greatest since 2014.

http://ocean.dmi.dk/arctic/icecover_30y.uk.php
It is of course far too short a period to pretend to identify any real trends, but it is clear that the short period of decline before 2007 has now finished.
In addition, most of the ice is two meters or more thick, in stark contrast to ten years ago.


32 Comments
Comments are closed.

And the situation around Antarctica is pretty normal too:
https://nsidc.org/data/seaice_index/
Sorry. You have to click on – switch to – ‘Antarctica’ and then on ‘Daily.’
Bottom part of linear negative trend or bottom of cycle? See here this time next year.
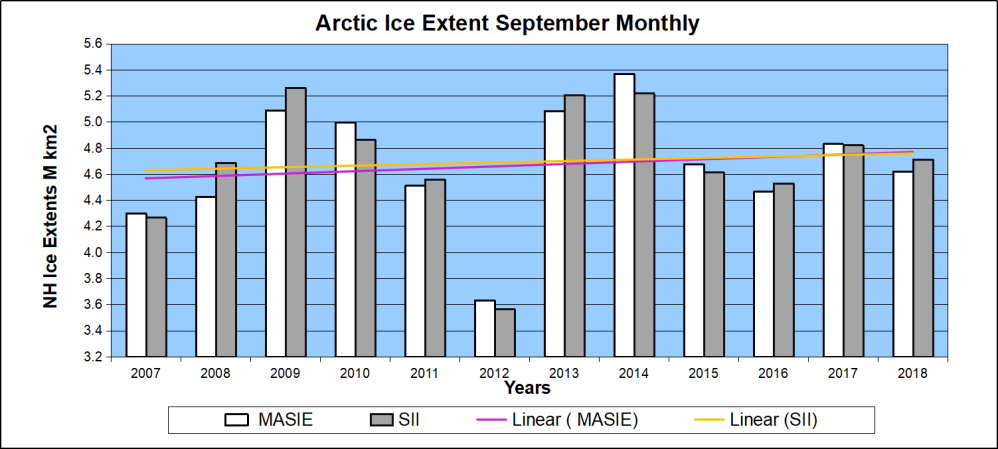
Here are the September monthly averages from MASIE and SII
Full report: https://rclutz.wordpress.com/2018/10/01/try-to-remember-theres-ice-in-september/
next week’s of Radio4 Costing the Earth
Oct 9th \\ The Arctic is warming twice as fast as the rest of the planet. That’s certain to impact on the weather we experience in Britain.
Physicist Helen Czerski and a boatload of international scientists have just spent a month at the North Pole conducting experiments to find out much more about the impacts of this extraordinary change to our planet.
Join Helen on the Arctic ice floes for the very latest research on the rapid changes to the far north.//
https://www.bbc.co.uk/programmes/m0000nhx
Oct 16th edition : Women and Climate Change : Eco-Feminism
“Programme looking at *man’s* effect on the environment and how the environment reacts” sic
https://www.bbc.co.uk/programmes/m0000qmk
Given that the rest of the planet doesn’t appear to be warming very much (see latest UAH data), twice that amount doesn’t seem like anything to worry about. What data do they use to determine the “extraordinary” Arctic warming?
“Is warming twice as fast” is well past its sell-by date, hence being milked to death. Warmed twice as fast a few decades ago … just doesn’t make the grade in eco-marketing 101.
Arctic goes “eco feminism”?
It makes you shudder, where is the Ursa Major when you need one?
yeah, even more mental than before when it was just moonbat like, prince chucklechops, of the NSIDC serreze and cambridge fixation man ‘sea ice death spiral coming very, very, very oh so soon’ wadhams.
Czerski’s North Pole research has been covered a lot on BBC R4 Science progs, no doubt they were hoping for “no-ice”, but when that failed to happen she described what they were doing, which is just to get better data on ice-atmosphere interactions. The talk about rapid changes is just BBC promotional hype, but will no doubt form a major part of the upcoming prog, given what we know about green activist infiltration of the BBC.
The Central Arctic NEVER melts much,
‘They’ were hoping for an open ‘lead’ or extensive melt-water pond which they could photograph as proof, for the enraptured, of the ‘Coming of the Heat.’
Everything in nature that shows a trend in an undesirable direction is not therefore caused by global warming.
https://tambonthongchai.com/2018/08/04/does-global-warming-drive-changes-in-arctic-sea-ice/
Reblogged this on Climate Collections.
So how many Wadhams are left?
What is very striking to me on the DMI plot is the pattern of the residuals – the differences between the trend line and the observations. In the 1990s and early this century most of the residuals are positive, followed by a run of negative values through 2012, and a return to positive values thereafter. Anyone running statistical tests for serial correlation would see alarm bells ringing on the assumption of a linear trend. Correcting the regression calculations to take account of this would reduce the certainty of the slope coefficient and the correlation coefficient. Such a pattern of residuals isn’t really consistent with the linear assumption. It strongly suggests a model with a curve in it – for example a cycle.
I suspect there is enough to largely debunk the linear assumption, even though the data aren’t formally outside the supposed confidence limits if you wrongly stick with the assumption of random, normally distributed residuals. I’m increasingly tempted to find the underlying data and do the formal analysis with Durbin-Watson statistics and the rest of it.
But they never check their conclusions, either in the way you suggest, or for any kind of sense. And it’s not just Climate Science:
Prof Peter Hajek, Director of the Tobacco Dependence Research Unit at Queen Mary University of London, said:
“This new ‘finding’ is based on the bizarre assumption that for every one smoker who uses e-cigs to quit, 80 non-smokers will try e-cigs and take up smoking. It flies in the face of available evidence but it is also mathematically impossible. In the UK alone, 1.5 million smokers have quit smoking with the help of e-cigarettes. The ‘modelling’ in this paper assumes that we also have 120 million young people who became smokers.”
Far too much science is published without anybody asking the obvious questions.
Footnote for those without a lot of statistics knowledge:
Linear regression assumes that residuals are random ( and occur with “bell curve” probabilities). That means that there should be a 50:50 chance of a residual being above ( or below) the trend line, just as with coin tosses. As a first approximation we can consider just the sign of residuals (more sophisticated analysis takes full account of their magnitudes as well). With coin tosses, the probabilities of a sequence of heads and tails of a given pattern and length are easy to calculate. The sequence HTTTTTTHHHHHH that occurs at the end of the chart has a probability of just 0..5^13 or about 0.012%. If you allow that the sequence might occur anywhere along the 40 data points, you could multiply that by (40-13)=27 which is still only 0.33%. In short, it is very unlikely.
http://www.statisticssolutions.com/assumptions-of-linear-regression/
Also – even more basic – time is not a causal variable.
Your assumptions are right, the linear trend is made possible by hiding the inconvenient data, which of course is the standard method of climate science alarmists:
https://realclimatescience.com/government-arctic-sea-ice-fraud/
I checked back to the real source for the DMI chart. They say this:
(my bold)
That’s pretty much an admission that they know that to produce the trend in this way is wrong, but they’re doing it to stay in step with NSIDC.
http://osisaf.met.no/p/new_ice_extent_graphs.php
Of course, the likes of Wadhams throw caution to the winds. Meanwhile, someone should ask what happens when the predicted sea ice from the linear trend turns negative, and again when it exceeds the surface area of the Arctic/Earth, and how they factor in Milankovitch cycles in the Earth’s orbit.
Great news! How many lives will this save?
You mean there is still Arctic ice? How inconvenient.
Solar minimum is imminent. Already 158 days without sunspots this year (2011-2015 grand total = 3).
See: http://spaceweather.com/archive.php [left column]
The longer the quiet sun continues, the weaker Cycle 25 probably will be. It is all very interesting, but it will take several years to play out.
Regarding the interesting theory that CFC’s had an effect on climate in the last fifty years, which will be reversed gradually now that further emissions are banned – that will take even longer to be tested, as the gases reduce only by 1% a year.
“DMI confirm that the average Arctic sea ice extent during September was the fourth highest since 2006, and the greatest since 2014.”
However their site still states this:
From my last email from them about this, I was told:
Truth moves very slowly in Denmark.
They are on the horns of a dilemma. They do not want to believe their instruments, but if they call the instruments liars (as their confreres are probably urging them to) their lives’ work is garbage.
Arctic ice comes, Arctic ice goes. Same as it ever was….
I am an old man, just past three score and ten, and I prefer warmth to cold.
What a sad commentary on the state of the world, then, that when I see evidence the Earth is not warming, my first feeling is satisfaction that this will annoy all the right people…
The DMI Arctic surface temperature was dropping like a stone pretty close to average, but has spiked back up and remains very warm. Other sources also show a very warm Arctic anomaly.
What is odd is that the ice still seems to be reforming at a similar rate to ‘usual’. I can only assume that the warmest air is away from the advancing ice edges?
Anyway, just shows yet again, there is no such thing as ‘normal’ in the Arctic.
“…very warm…”
Go out there in your birthday suit, and see how long you think this!
You will lose consciousness in an hour, be dead in a day, and a solid lump that even a polar bear would despise in two days.
https://climatereanalyzer.org/wx/DailySummary/#t2anom
All that has happened in the Arctic is that the very coldest air has moved to Canada and Greenland in a cold wave, and been replaced by less cold air from further South. A simple swap…happens all the time!
I think you would survive quite well, +10C above where it should be now and barely averaging below freezing.
Yes, I know where the cold air has gone, my point was that this is unusual at this point in the season, yet the ice was still increasing, although the effect of the warmth is now beginning to tell and ice formation is showing signs of slowing/stopping.
At some point there will be a dramatic plunge in temperature, that much is inevitable.
The air needs to be + 5 C for any melting to occur from direct contact with the atmosphere. I do not know if the incoming air is particularly moist – that always increases melting, as condensation of one molecule of H2O onto the surface releases enough heat energy to melt out seven molecules in the ice.
Of course, the main melting happens every year because of direct sunlight – which now is weak in the Arctic.
It seems that, rather like last year, thin sea-ice to the north of the coasts of Alaska and Siberia continues to clear or disperse, while the sea-ice on the side of Canada and Greenland is already thickening.
As you imply none of it really matters; the season has changed, and that is that.