EPA’s Updated Climate Change Data Shows Global Warming’s Impacts Are Already Here
By Paul Homewood
h/t Dennis Ambler
We’ve known for a long while, but this proves the EPA is not an objective, scientific organisation, but a purely political one:

The Environmental Protection Agency has revived its dashboard of key climate change indicators after four years with no updates.
From spikes in summer heat waves to sea level rise to the loss of melting ice sheets, the EPA says the data shows "compelling and clear evidence of changes to our climate."
EPA Administrator Michael Regan stressed the danger to the entire country.
"Americans are seeing and feeling the impacts up close with increasing regularity," Regan told reporters Wednesday, according to the Washington Post.
Here are some of the key impacts singled out by the EPA:
-Major U.S. cities average six heat waves a year, three times more than in the ’60s.
-Global concentrations of carbon dioxide, methane and nitrous oxide are unprecedented.
-Sea levels rose more than 8 inches along parts of the mid-Atlantic and Gulf coasts between 1960 and 2020.
-Arctic sea ice extent in September 2020 was more than 900,000 square miles less than the historical 1981–2010 average for that month — a difference three and half times the size of Texas.
-Ocean heat reached its highest level in recorded history last year.
https://weather.com/news/climate/news/2021-05-13-epa-climate-change-indicators-website-data
Let’s examine these claims:
1) Heat Waves
To use data from large cities is simply fraudulent, as these are heavily affected by UHI. Similarly, the choice of the 1960s as the base point is equally fraudulent.
Here’s the latest chart from the EPA:

https://www.epa.gov/climate-indicators/climate-change-indicators-heat-waves
But this is their Fig 3 on the same page:

The 1960s and 70s were a much colder interlude, so it is not surprising heat waves have increased since then. They are however much less intense nowthan during the 1930s, and no worse than the rest of the pre 1960 period.
2) Concentrations of Carbon Dioxide
Quite why this is an “impact of global warming” beats me. And Americans most certainly are not “seeing and feeling it”.
3) Sea Level Rise of up to 8 inches since 1960
Sea levels have been rising steadily since the end of the Little Ice Age in the late 19thC.
Over the last fifty years, sea levels on the East Coast have been rising at a rate of around 3 to 4mm /yr, a total of about 7 inches. However, the rate of rise was just as great in the first half of the 20thC:
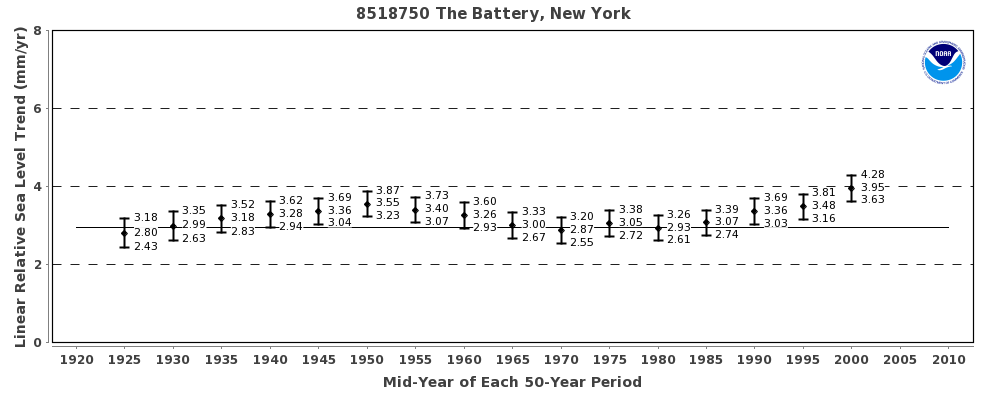
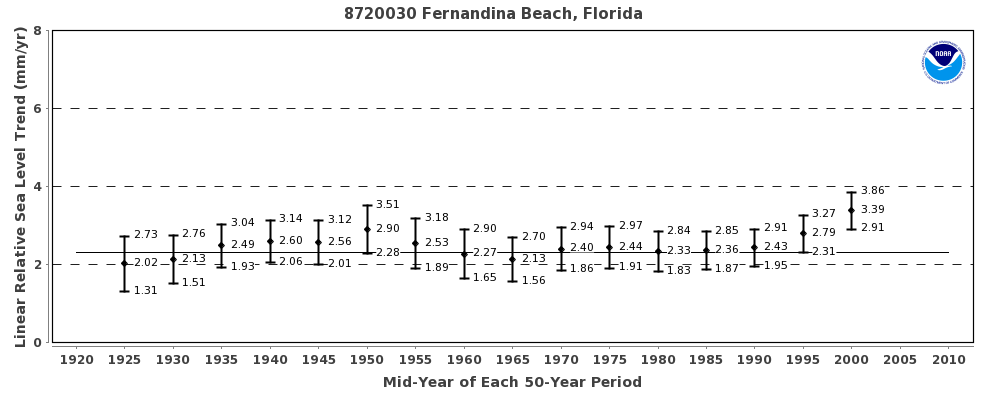
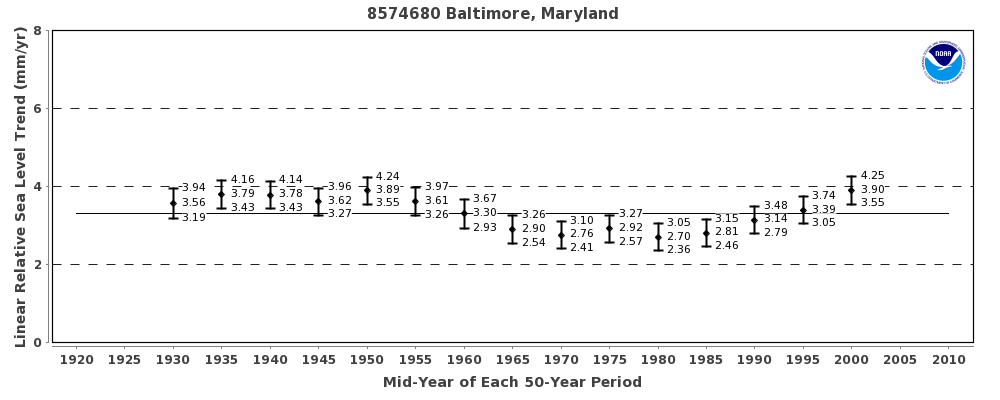
Part of this sea level rise is caused by sinking landmasses, known as isostasy, the result of the melting of the Ice Age glaciers. This typically accounts for between 1mm and 3mm a year.

https://www.thegwpf.org/official-us-climate-data-reveals-no-cause-for-alarm/
4) Arctic Sea Ice Extent
Now they’re getting desperate!
Sea ice extent has actually been stable since 2007, and there is no evidence whatsoever that it has any impact at all on America, one way or another.
5) Ocean Heat
Again, more desperation!
The claimed changes in ocean heat content are so tiny that they simply cannot be accurately measured, even with modern technology.
In any event, the small increase in heat content is consistent with the gradual warming of the climate since the Little Ice Age.
Bogeyman
The simple reality is that the EPA have been totally unable to find any detrimental effects of global warming in the United States, and have therefore had to resort to this assortment of cherry picking and irrelevant bogeymen..
Indeed, as the EPA’s own graphs below prove, there have been no trends in hurricane activity, droughts were much worse in the past, there has been little change in river flooding and extremely cold weather is now a rarity. In other words, the sort of things people do worry about.
It is, of course, significant, that the EPA have rushed to bring out this piece of political disinformation so soon after the election, after it had not been updated during Trump’s term.


Comments are closed.

Concentrations of Carbon Dioxide
Quite why this is an “impact of global warming” beats me. And Americans most certainly are not “seeing and feeling it”.
Actually, as the oceans warm even slightly, one would expect carbon dioxide solubility to decrease and hence rather more to be present in the atmosphere. So they might be right here, although I doubt if that is what they meant.
Carbon dioxide levels in the geological past were more than double what they are now and life on land and in the seas thrived. “Unprecedented” to the EPA refers to pre-industrial levels and it should be obvious that much of what is in the atmosphere is from humans burning carbon for their unprecedented standards of living and lifestyles. The correlation between Mauna Loa CO2 and human population is almost perfect. The global temperature anomaly has responded by rising a fractional amount.
Ocean heat and CO2 fluctuates as the history of the natural equatorial Pacific ENSO demonstrates. However, over time there is no correlation between the ENSO and Mauna Loa CO2.
I think that they were implying that the increase in CO2 caused the ocean warming, surely it is the other way round.
Strange that artic ice coverage is within it, s normal range for May, exclude the Canadian East Coast, which is not in the Arctic and it it would be normal. The antarctic is above normal, and has been for many years.
Can’t say I’ve noticed any Global Warming in the south-east of England. Funny thing, but I was only thinking about a month ago as to when a previous long spell of cold weather has persisted in this part of the UK. It is now nearly nine months since it started.
If the EPA has this big stock of Global Warming, then they are more than welcome to send some my way.
Me neither – just returned from buying a couple of bags of coal as the evenings on days without much sun are still quite chilly and I turn the heating off on 1 May. The coal works nicely with the wood to provide a nice cosy evening. Of course last year I had the fire lit twice in June as we had 2 nights of hard frost.
Gerry, last year I could just about have turned off the GCH on Easter Monday 2020! This past week was quite warm, only 14 units of gas used but since 1 Jan 2021 consumption here has been in mid-twenties to almost three times that during the snowy week in February. I’m not that far off sea level so no high altitude, Dartmoor/Exmoor type frosts here.
My memory of the last thirty years has been for a couple of months of cold, maybe three, each winter but not a period of nine months of constant chilly to cold to very cold weather.
Their last chart does not appear to be correct, over the last few year Low temperature records have been broken in their hundreds, but do not appear in that chart.
There is a 12 page supplement in today’s Times which tries to set out answers to ” How business is tackling climate change”. It seems to me that this is all part of educating politicians and impressionable lenders so as to be able to borrow at historically low rates of interest for hare-brained schemes. Gormley’s stiffs on Crsby Beach feature on the front page with the Liverpool Bay windfarm in the background. Emily Gosden features heavily among the authors.
Businesses “tackling” climate change? Opening their great insatiable maws so that governments can shovel more poor people’s money into them more like.
The tragedy of all this bad science is that the media do not publish any “denier” letters or articles. They have a lot to answer for!!!!
EPA is manipulating data to get the right answer. This reference hits the nail on the head
One expects politicians and the general public to fall for all this climate change nonsense but it would appear that many hard headed businessmen are now astonishingly committing billions to any hair brained scheme that appears!
Jim Shanley;
Consider that a CF of H2O weights in at about 64 lbs and air is so small that it’s not worth computing and Co2 comprises only about .o4 percent of air. so I think we should eliminate
the atmosphere as a source of heat to the oceans. It has long been known that the oceans receive solar radiation, heat from the earth, heat from under sea volcanoes and vents and then there are fish that live and die in the ocean. Heat does not build up in the oceans; it is disposed of on a daily basis by evaporation. The system has been working perfectly like forever, we cannot change nature.
Even if the “ocean heat” went up by a lot, it does not matter. Fish do not care about ocean heat; they care about temperature.
The reason why reports mention ocean heat instead of temperature is that the temperature change is expressed in hundredths of degrees, which does not look scary. Changes in ocean heat can be expressed in the order of 10^20 Joules. Big numbers are scary.
Someone needs to stipulate how much carbon dioxide we need to maintain our environment rather than just procrastinate about the current or previous levels. I would imagine that any difference in the levels of this gas can be directly attributed to building-over nature, bare earth, grasslands, the toppling of forests (like HS2). That is a figure I would be interested in seeing, the correlation. If such a figure could be established then perhaps Britain, for one, would merely regulate its population levels better. Is it fair to suggest that it’s the houses themselves and not any emissions that they are are giving off, a misattribution of statistics?
Nom problems. Many Thanks. Now I need to find where Fryston is………….! Cheers Pete Y
Peter: Temperature is merely tool for measuring the amount of heat per unit amount of
material. Also, fishermen know that fish prefer cold water, probably because O2 levels are higher.
europeanonion; Does anyone know how much CO2 life on earth requires? We get O2 from CO2 and we need a lot of oxygen to replace what is being consumed. If more CO2 gives us more O2 then thats a good thing; Perhaps I can get rid of my oxygen concentrator.