Global Temperature Datasets “are not a valid representation of reality”.
By Paul Homewood

https://thsresearch.files.wordpress.com/2017/05/ef-gast-data-research-report-062717.pdf
I missed this report at the time, but it is a comprehensive account of how large scale adjustments of temperatures have made global temperature datasets virtually worthless.
ABSTRACT
The objective of this research was to test the hypothesis that Global Average Surface Temperature (GAST) data, produced by NOAA, NASA, and HADLEY, are sufficiently credible estimates of global average temperatures such that they can be relied upon for climate modeling and policy analysis purposes. The relevance of this research is that the validity of all three of the so- called Lines of Evidence in EPA’s GHG/CO2 Endangerment Finding require GAST data to be a valid representation of reality.
In this research report, the most important surface data adjustment issues are identified and past changes in the previously reported historical data are quantified. It was found that each new version of GAST has nearly always exhibited a steeper warming linear trend over its entire history. And, it was nearly always accomplished by systematically removing the previously existing cyclical temperature pattern. This was true for all three entities providing GAST data measurement, NOAA, NASA and Hadley CRU.
As a result, this research sought to validate the current estimates of GAST using the best available relevant data. This included the best documented and understood data sets from the U.S. and elsewhere as well as global data from satellites that provide far more extensive global coverage and are not contaminated by bad siting and urbanization impacts. Satellite data integrity also benefits from having cross checks with Balloon data.
The conclusive findings of this research are that the three GAST data sets are not a valid representation of reality. In fact, the magnitude of their historical data adjustments, that removed their cyclical temperature patterns, are totally inconsistent with published and credible U.S. and other temperature data. Thus, it is impossible to conclude from the three published GAST data sets that recent years have been the warmest ever –despite current claims of record setting warming.
Finally, since GAST data set validity is a necessary condition for EPA’s GHG/CO2 Endangerment Finding, it too is invalidated by these research findings.
The Report includes many relevant graphs of both global and regional temperatures. It is well worth bookmarking.
Trackbacks
Comments are closed.

I suspect that poor spatial sampling in GHCN is behind many homogenisation errors, and have recently discovered that there are only 62 stations in Australia currently providing updates to the monthly version of GHCN, the version used to produce “official” global temperature variations:
Why do you think that they are “errors”?
They do exactly what the warmists want them to do, align the temperature record with the rise of CO2.
Here is my attempt to briefly summarize this issue.
https://rclutz.wordpress.com/2018/01/28/what-is-global-temperature-is-it-warming-or-cooling/
The glories of constructing anomalous anomalies.
Take some teperature readings without account of the error bands of the recording instruments. Ignore the ones you don’t like, make up others you don’t have. Can’t use them together so decide on the best time period to prove what you wanted to prove in the first place, and average the difference between the invented temps and the average temp across this time period.
Then stick this concoction into as complicated looking computer model as you can make , run it for as long as you dare, and hey presto you create a ‘dogs breakfast’ of a forecast ( sorry not allowed to call it that).
This is ‘science’.
Thanks Paul (and bookmarked).
On a meme.
I have yet to read a better critique a more witheringly concrete analysis than the Ross McKitrick paper,
“A critical review of global surface temperature data products” :
1.2.3. Growing bias toward lower latitudes
The decline in sample has not been spatially uniform. GHCN has progressively lost more and more high latitude sites (e.g. towards the poles) in favour of lower-latitude sites. Other things being equal, this implies less and less data are drawn from remote, cold regions and more from inhabited, warmer regions. As shown in Figure 1-7, mean laititude declined as more stations were added during the 20th century.
Here’s another interesting paragraph:
2.4. Conclusion re. dependence on GHCN
All three major gridded global temperature anomaly products rely exclusively or nearly exclusively on the GHCN archive. Several conclusions follow.
They are not independent as regards their input data.
Only if their data processing methods are fundamentally independent can the three series be considered to have any independence at all. Section 4 will show that the data processing methods do not appear to change the end results by much, given the input data.
Problems with GHCN, such as sampling discontinuities and contamination from urbanization and other forms of land use change, will therefore affect CRU, GISS, and NOAA. Decreasing quality of GHCN data over time implies decreasing quality of CRU, GISS and NOAA data products, and increased reliance on estimated adjustments to rectify climate observations.
WUWT link
PDF here:
Click to access McKitrickCriticalGHCNReview.pdf
WMO-
Africa , one fifth of the World’s land mass- Estimated temps.
“Because the data with respect to in-situ surface
air temperature across Africa is sparse, a one year
regional assessment for Africa could not
be based on any of the three standard global
surface air temperature data sets from NOAANCDC,
NASA-GISS or HadCRUT4. Instead, the
combination of the Global Historical Climatology
Network and the Climate Anomaly Monitoring
System (CAMS GHCN) by NOAA’s Earth System
Research Laboratory was used to estimate
surface air temperature patterns”
What will these charalatans do if it turns out that projections of lower solar input are true, and real temperatures start falling? Will we see the freezing point of water redefined?
Outstanding! The worm is turning.
‘totally inconsistent with published and credible U.S. and other temperature data’
In other words, a pack of lies.
While true that the surface temperature records are not fit for purpose, I dont think it a forceful argument against CAGW believers because too complex.
IMO better is to point out that the warming from ~1920 to 1945 is indistinguishable from that of ~1975-2000 (there was essentially only slight cooling between 1945 and 1975). But IPCC AR4 WG1 SPM figure 4 said the earlier warming wasn’t AGW while the latter period was. This makes no sense, and raises the attribution problem in spades. It explains why models run hot because CMIP5 parameters were explicity tuned to best hindcast 1975-2005, and essentially invalidates the climate model projections. Leaving warmunists with nomlegs to stand on. Example, except for the now cooled 2015-16 El Nino blip, no warming this century. Yet that period comprises ~35% of the increase in atmospheric CO2 since 1958 (Keeling curve). A period where the models of the tropical troposphere run >3x hotter than balloon, satellite, and reanalysis estimates (per Chrity congressional testimony March 29 2017).
Three Simple visuals—-temp record, SPM fig 4, Christy chart 1. All Irrefutable. Killer.
Really? I am surprised that you are not more sceptical. There were many contemporaneous papers suggesting that the Northern Hemisphere cooled by 0.5 to 0.7 degC during this period. Even Phil Jones (1980) and Hansen (1981) papers show the Northern Hemisphere having cooled at least 0.5 degC during the period 1940 to 1980. Hansen’s 1981 paper suggests that the Northern Hemisphere was as at around 1980 still some 0.3 degC cooler than it was in 1940.
The very first IPCC Report (1990) shows the Northern Hemisphere cooler than it was in 1940! This was notwithstanding the mid 1970s onwards warming which had apparently taken place!! Look at figure 7.11 on page 214 of FAR and you will see that the Northern hemisphere (land and sea temps) is still cooler than the 1920s and the 1940s. So even by 1990 there had not been a full recovery in Northern Hemisphere temperatures, and then of course there was the about 20 year pause.
In Phil Jone’s 1980 paper he notes that the data with respect to the Southern Hemisphere is unreliable; it being sparse and poorly spatially sampled. In the Climategate emails he was a little more forthright stating that it was largely made up between the tropics and Antarctica. And he is right on that observation. Hansen in his 1981 paper notes what Phil Jones has to say about the Southern Hemisphere without demur.
The truth of the matter is that we have no idea as to Southern Hemisphere temperatures, even today it is too sparsely sampled, but the problem is historic. Unfortunately, there is no worthwhile data of the late 1930s/early 1940s so we cannot make any assessment of changes on a Southern Hemisphere basis, and hence nor on a global basis.
We only have poor data covering the Northern Hemisphere, and that poor data hints that today is no warmer in the Northern Hemisphere than it was during the highs of the 1930s/early 1940s. The material point being that this is so, notwithstanding that about 95% of all manmade CO2 emissions have taken place since the late 1930s.
More evidence of AGW inspired fraud.
When is it going to end and when will the fraudsters face justice for their crimes against Humanity?
“When is it going to end and when will the fraudsters face justice…?”
‘2035’ and ‘Never’ are my guesses.
The report tallies with many of the publications on this site. However, apart from the obvious, and well known, cause for concern that data are being repeatedly “adjusted” with no apparent justification, there are a few other points that stand out: –
The number of measuring stations has fallen rapidly, by 75% since 1990, and 49% of these are at airports, a major source of sudden high temperatures and UHI effect.
The lack of measurements in many areas of the world and sparseness of oceanic and polar measurements stand out as major weaknesses in claiming a global mean temperature anomaly with any sensible accuracy.
The change from thermometers to RTDs in the 1980s alters the ease of comparison.
No doubt our top energy reporters like Ambrose, Harrabin and Shukman will rush to point out that Henny-Penny Hanson was wrong …. ho,ho!
“. . . with no apparent justification, . . .”
For some issues adjustments are needed. Time of observation changes from afternoon to morning (TOB) and the urban heat island effect are two that anyone can understand the need for. You may not agree with the method or results. If so, try to develop your own better ways.
Beyond saying this, I don’t believe these weather data were designed for climate studies and are not worth all the effort folks do to try and use them.
UHI should lead to cooling of recent data, not of older data. And max-min data is time-irrelevant.
I don’t mind genuine attempts to adjust data for some purposes, but the accuracy is impossible so judge so the adjusted data is little more than a curiosity.
Before doing adjustments for TOB any sensible scientist would do a long term study by taking both measurements over widespread sites over a long time period. Has this been done?
If it has that’s fine, if not the adjustment is a guess.
For UHi a similar process is required, TV and radio weather forecasts tacitly acknowledge UHI of several degrees Centigrade under certain weather conditions, therefore UHI is not consistent and varies day to day is this taken into account?
If it is then fine, if not it is just a guess.
Steven Goddard has sought to examine TOBS, and he finds no statistical difference in temperature trends from stations that report temps in the morning or the afternoon. See: https://realclimatescience.com/?s=TOBS
I am not sure that his methodology is sound, but it does suggest, at least on a prima facie basis, that there may be no need to make any TOBS adjustment when one is dealing with a lengthy record, say temperature data extending over 60 to 100 years.
For example:
compare with the adjusted record:
Note what I wrote:
” I don’t believe these weather data were designed for climate studies and are not worth all the effort folks do to try and use them.”
Seems we all agree on this.
A few Years ago, back in 1914 to be exact, there were three different versions of adjusted temperatures for more than 1200 weather stations in the USA. These came from the GHCN, GISS and the USHCN. Back then, I compared the difference between the versions for several different pairs of years. Some of the results were truly startling.
For example, Ashland in Kentucky had values for both 1895 and 2013 in both the USHCN and the GHCN. The GHCN shows a warming of 1.3 degrees F, whereas the USHCN shows a cooling of 2.6 F. The difference is thus 3.9F
Of course, this is an exceptional result, but it does illustrate that the adjustments are not an exact science!
“… back in 1914 . . . I compared …”
Off da ! You are old.
https://en.wikipedia.org/wiki/You_Are_Old,_Father_William#Text
Using max-min to create your average also causes huge problems. A day of 10 and 0 has the same average as a day of 6 and 4, but those days are totally different and the “average” if you took say 100 readings is likely to be very different.
The interpolations are just junk. Take two stations say. You want to know the temperature in between them. They both read 10 degrees. Some days in between it will be 9, some days 10, some days 11. Maybe some days it’s 14 and some days it’s 6. You cannot know without measuring it over a long period and at that point you don’t need to guess!
Also, to reflect a better representation of a day you need the mean temperature, not the difference between max and min. This is particularly true in mobile conditions when different air masses cross (frontal systems) cross a location.
Whilst you can have a max of say 10C in warm air for a lot of the day, and a cold front goes through very late in the day and there is a min of 2C, the difference between max and min would be 6C, but more representative might be 8C or 9C.
Which reinforces Phoenix44’s argument and simply adds more weight to the case against using temperature as any sort of reliable measure of anything except how warm/cold it is here now.
Even Hansen argued that there was no such thing as a global mean temperature and such a figure was not a useful metric to gauge global warming. But if not that then what? Schellnhuber creates the 2° target figure because the pollys like something nice and simple that they can “sell” to the sheeple (who are not that gullible) but 2° above what baseline when?
And what happens if my bit of the planet has passed 2° and yours hasn’t? And never mind “anomalies”. What was the actual (mythical?!) GMT in 1900 and what is it today and does it matter?
My answer to my last two questions is “I don’t know and I don’t care” and “no, unless someone can provide with sensible evidence to the contrary.”
At the moment we appear to be living on the fringe (joke) of Miller’s ‘End of the World’ sketch — “When will it be, this end of which you have spoken?”
And 30 seconds later: “Never mind, lads; same time tomorrow. We must get a winner one day.” Which wouldn’t matter if the mad cultists weren’t trying to take us along with them!
Phoenix44 is right: “UHI should lead to cooling of recent data, not of older data.”
But, if one looks at what NOAA has done to the older US Weather Bureau data in the US, almost every state has been LOWERED by an average of about 0.8°F. They offer as an explanation? New innovative algorithms. Problem solved!
Something I have noticed recently in the UK whilst collecting daily weather data. Three of the weather reporting stations used to report 48×1/2hourly obs. They now only report between about 6am and 10pm.
Of course that misses out the coldest part of the day. Another way of warming things up perhaps, but I’m just a cynic.
RSS Satellite temperature dataset revised – go on – guess
Carbon Brief is gloating
“After correcting for problems caused by”………………………….
Well no shit, without correction – is there Sherlock?
That is old news. And Paul noted it, as RSS “nobbled.”
My comment at the time was that they had sold their birthright for a mess of pottage. The small, obviously contrived, changes enabled fools – like the “Carbon Brief” – to emit sundry, “hottest evah” screams – but it was strictly a one-off tid-bit, and that was all.
Scientifically, it was, indeed, shit.
Although this sort of thing ensures “hoi polloi” stays “on message” for a little longer, it do’n’t impress me none. Ten years ago, I used to wonder if all these new-fangled ‘climate specialists’ might be on to something. The more doggedly they embarrass themselves, the more negligible they become in my eyes.
“The more doggedly they embarrass themselves, the more negligible they become in my eyes.”
Indeed.
In the outset (Hansen, Mann et al) they never had any credibility what is clear now as it always was, is that the original supposition was a complete crock. ‘The scientific onsensus’ is cracking, they know damn well that ‘whirld’ Temperatures if there is such a thing – aren’t running “off the dial” all that remains for these charlatans is jumping the shark.
It should be interesting how the Met Office treats next weeks temperatures,
I note that Joe Bastardi feels the upcoming ‘Warming Hole’ in Europe is significant to comment on.
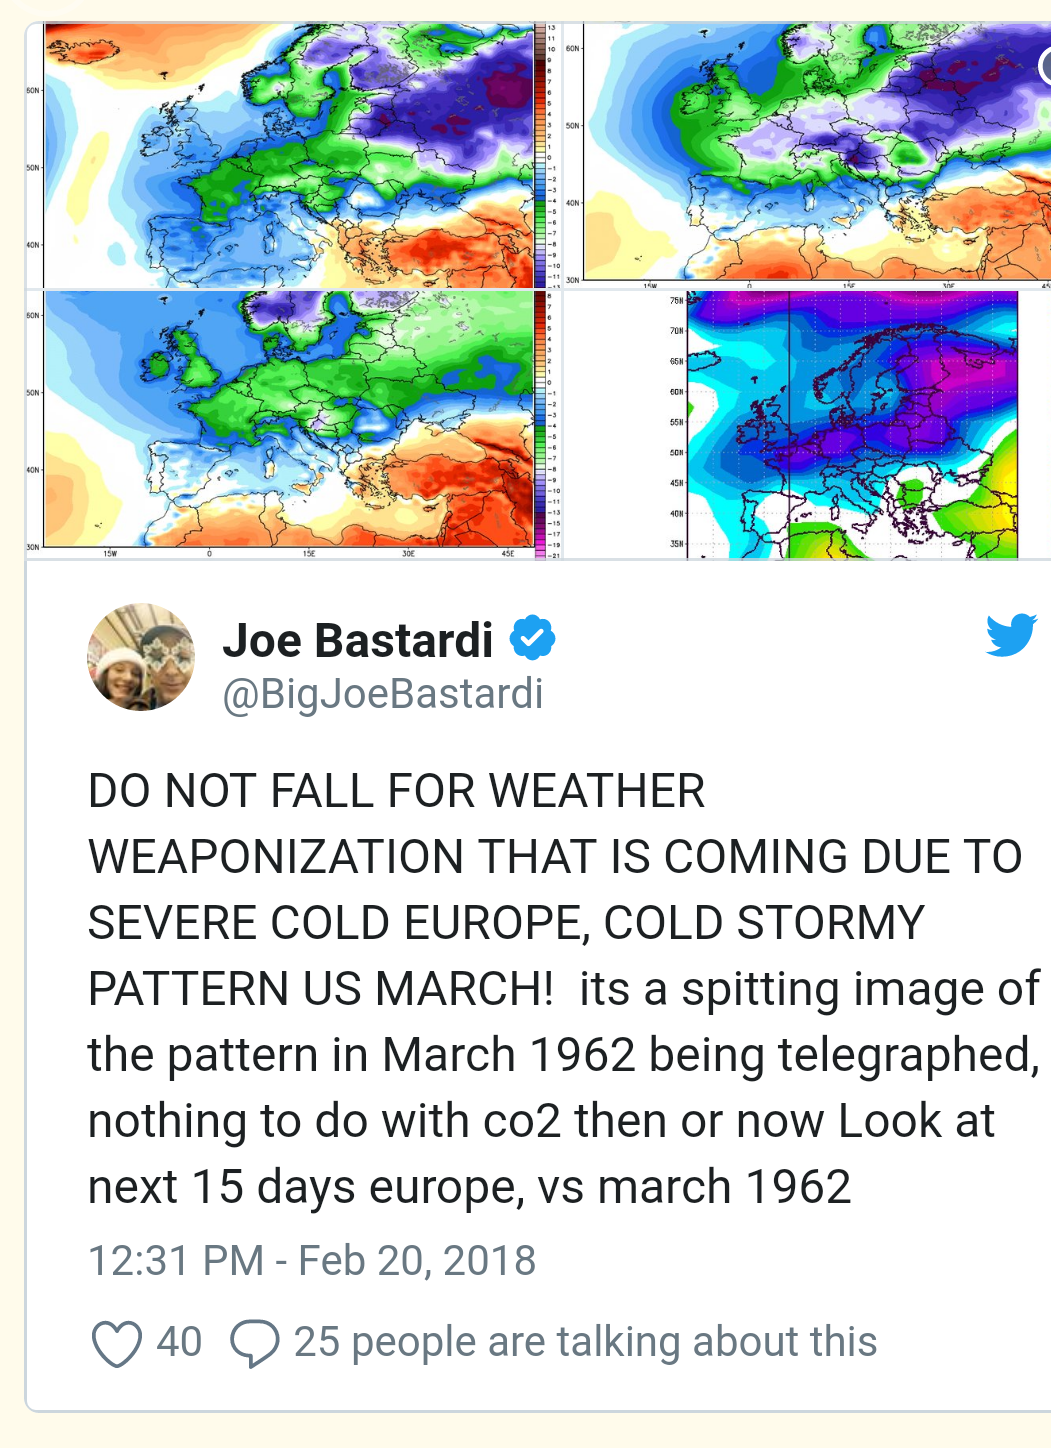
You have a SSW coming next week and could last well into March.
https://www.theguardian.com/uk-news/2018/feb/19/sudden-stratospheric-warming-set-to-bring-lengthy-cold-snap-to-uk
ES,
The Sudden Stratospheric Warming (SSW )has already happened, it started last week, see here —
http://ds.data.jma.go.jp/gmd/tcc/tcc/products/clisys/STRAT/index.html
What take time is the way it filters down to the lower levels of the atmosphere (it does not always happen!), how fast it filters down (anything from a couple of days to 30 days), and what regions will be affected.
Unfortunately this sort of event is poorly understood and can not be predicted by science. Both weather and climate models are at a loss for what to do when a SSW event happens. As one weather forecaster said something like this recently, “It’s like dropping a meteorological bomb onto the atmosphere and trying to guess where all the pieces will land”.
Sorry to be OT but has anyone else seen the latest appeal by the WWF for us all to adopt a polar bear? Nice propaganda film of a polar bear on some thin ice. I suspect that the speil may contain several actual lies which would mean that the advertising authorities might need informing about it.
GISS personnel who manipulate or falsify climate data are committing a federal crime.
Title 18 of the United States Code contains the federal criminal law. Section 2071 sets out the elements of the crime of manipulating or falsifying government records
To summarize the statute, anyone who has official custody of any record on filed in any public office of the United States and willfully and unlawfully mutilates, obliterates, or falsifies such a record has violated the statute and shall be fined or imprisoned for up to three years under it, or both. Generally, a felony is defined as a crime calling for imprisonment in a penitentiary for more than one year. That makes violating Section 2071 a felony, not merely a misdemeanor.
18 U.S. Code § 2071 – Concealment, removal, or mutilation generally
(a) Whoever willfully and unlawfully conceals, removes, mutilates, obliterates, or destroys, or attempts to do so, or, with intent to do so takes and carries away any record, proceeding, map, book, paper, document, or other thing, filed or deposited with any clerk or officer of any court of the United States, or in any public office, or with any judicial or public officer of the United States, shall be fined under this title or imprisoned not more than three years, or both.
(b) Whoever, having the custody of any such record, proceeding, map, book, document, paper, or other thing, willfully and unlawfully conceals, removes, mutilates, obliterates, falsifies, or destroys the same, shall be fined under this title or imprisoned not more than three years, or both; and shall forfeit his office and be disqualified from holding any office under the United States. As used in this subsection, the term “office” does not include the office held by any person as a retired officer of the Armed Forces of the United States.
I have written to the U.S. Attorney General’s office reminding it that this statute applies to the agency’s “charlantry” but have received no response. None of us have the necessary legal “standing” to sue for the crime. I would like encourage everyone who feels outraged by this to urge the USAG to prosecute..
From the Abridged Research Report:
“There was a major station dropout (75% of the stations), which occurred suddenly around 1990. And, the remaining stations are disproportionally urban with 49% at airports.”
It would be interesting to see global-average temperature results (separate raw and adjusted results) for the following two cases:
1) Data only from stations with data records that ended in 1990
2) Data solely from stations currently reporting data.
How would the raw/adjusted results for cases (1) and (2) above compare with each other for the 1880-1990 time-period?
How would (1) and (2) above (separate raw and adjusted data results) compare with the NASA global land-station results?
Regarding rural non-airport stations vs. urban airport stations, if you were to compute separate global-average temperature results for rural non-airport station data vs urban airport station data (raw and adjusted), how would those results compare with each other? How would those results (raw and adjusted) compare with the NASA global land-station results?
Someone who is experienced programmer and is familiar with the GHCN data could do all the above in a matter of days (that includes writing basic global temperature computation software from scratch).
The skeptical community is been raising the above objections to the NASA/NOAA global temperature work for over a decade. I find it surprising that the authors of the Abridged Research Report did not compute their own global-average temperature results as described above in order to quantify the effects of station dropout, airport vs. non-airport station status, etc. on global-average temperatures.
OT but Jonova has a very interesting graph showing the effect of “renewables” on electricity prices.
http://joannenova.com.au/2018/02/electricity-prices-fell-for-forty-years-in-australia-then-renewables-came/