Brace Yourself For More Heatwaves Says Young Joe Pinkstone
By Paul Homewood
Isn’t it time the Mail found young Joe Pinkstone a job he knew something about? Maybe reporting on Justin Bieber’s latest concert?

The next four years will be ‘anomalously warm’ worldwide, scientists have warned.
New research suggests unusual heat will become commonplace until 2022 – leading to more wildfires, drought, and increased probability of ‘extreme’ temperatures.
Scientists predict that water in the oceans will warm faster than air above land, which increases the risks of floods, hurricanes, typhoons and cyclones worldwide.
These extreme weather events could prove fatal for people across the globe.
The paper he quotes makes no mention, in the Abstract at least, about floods, wildfires or hurricanes. Presumably they are a figment of Joe’s young impressionable mind.
Hurricane activity during the last 12 months has actually been relatively low:

Wildfires in the US used to be far worse prior to the 1950s:

https://notalotofpeopleknowthat.wordpress.com/2014/06/09/wildfires-were-much-worse-in-past/
And according to the National Interagency Fire Center, so far this year wildfires in the US have been nothing unusual:

https://www.nifc.gov/fireInfo/nfn.htm
And there is certainly no evidence that floods are worse than normal this year.
As for heatwaves, what is the likelihood that the next four years see a return of typical British summers again?

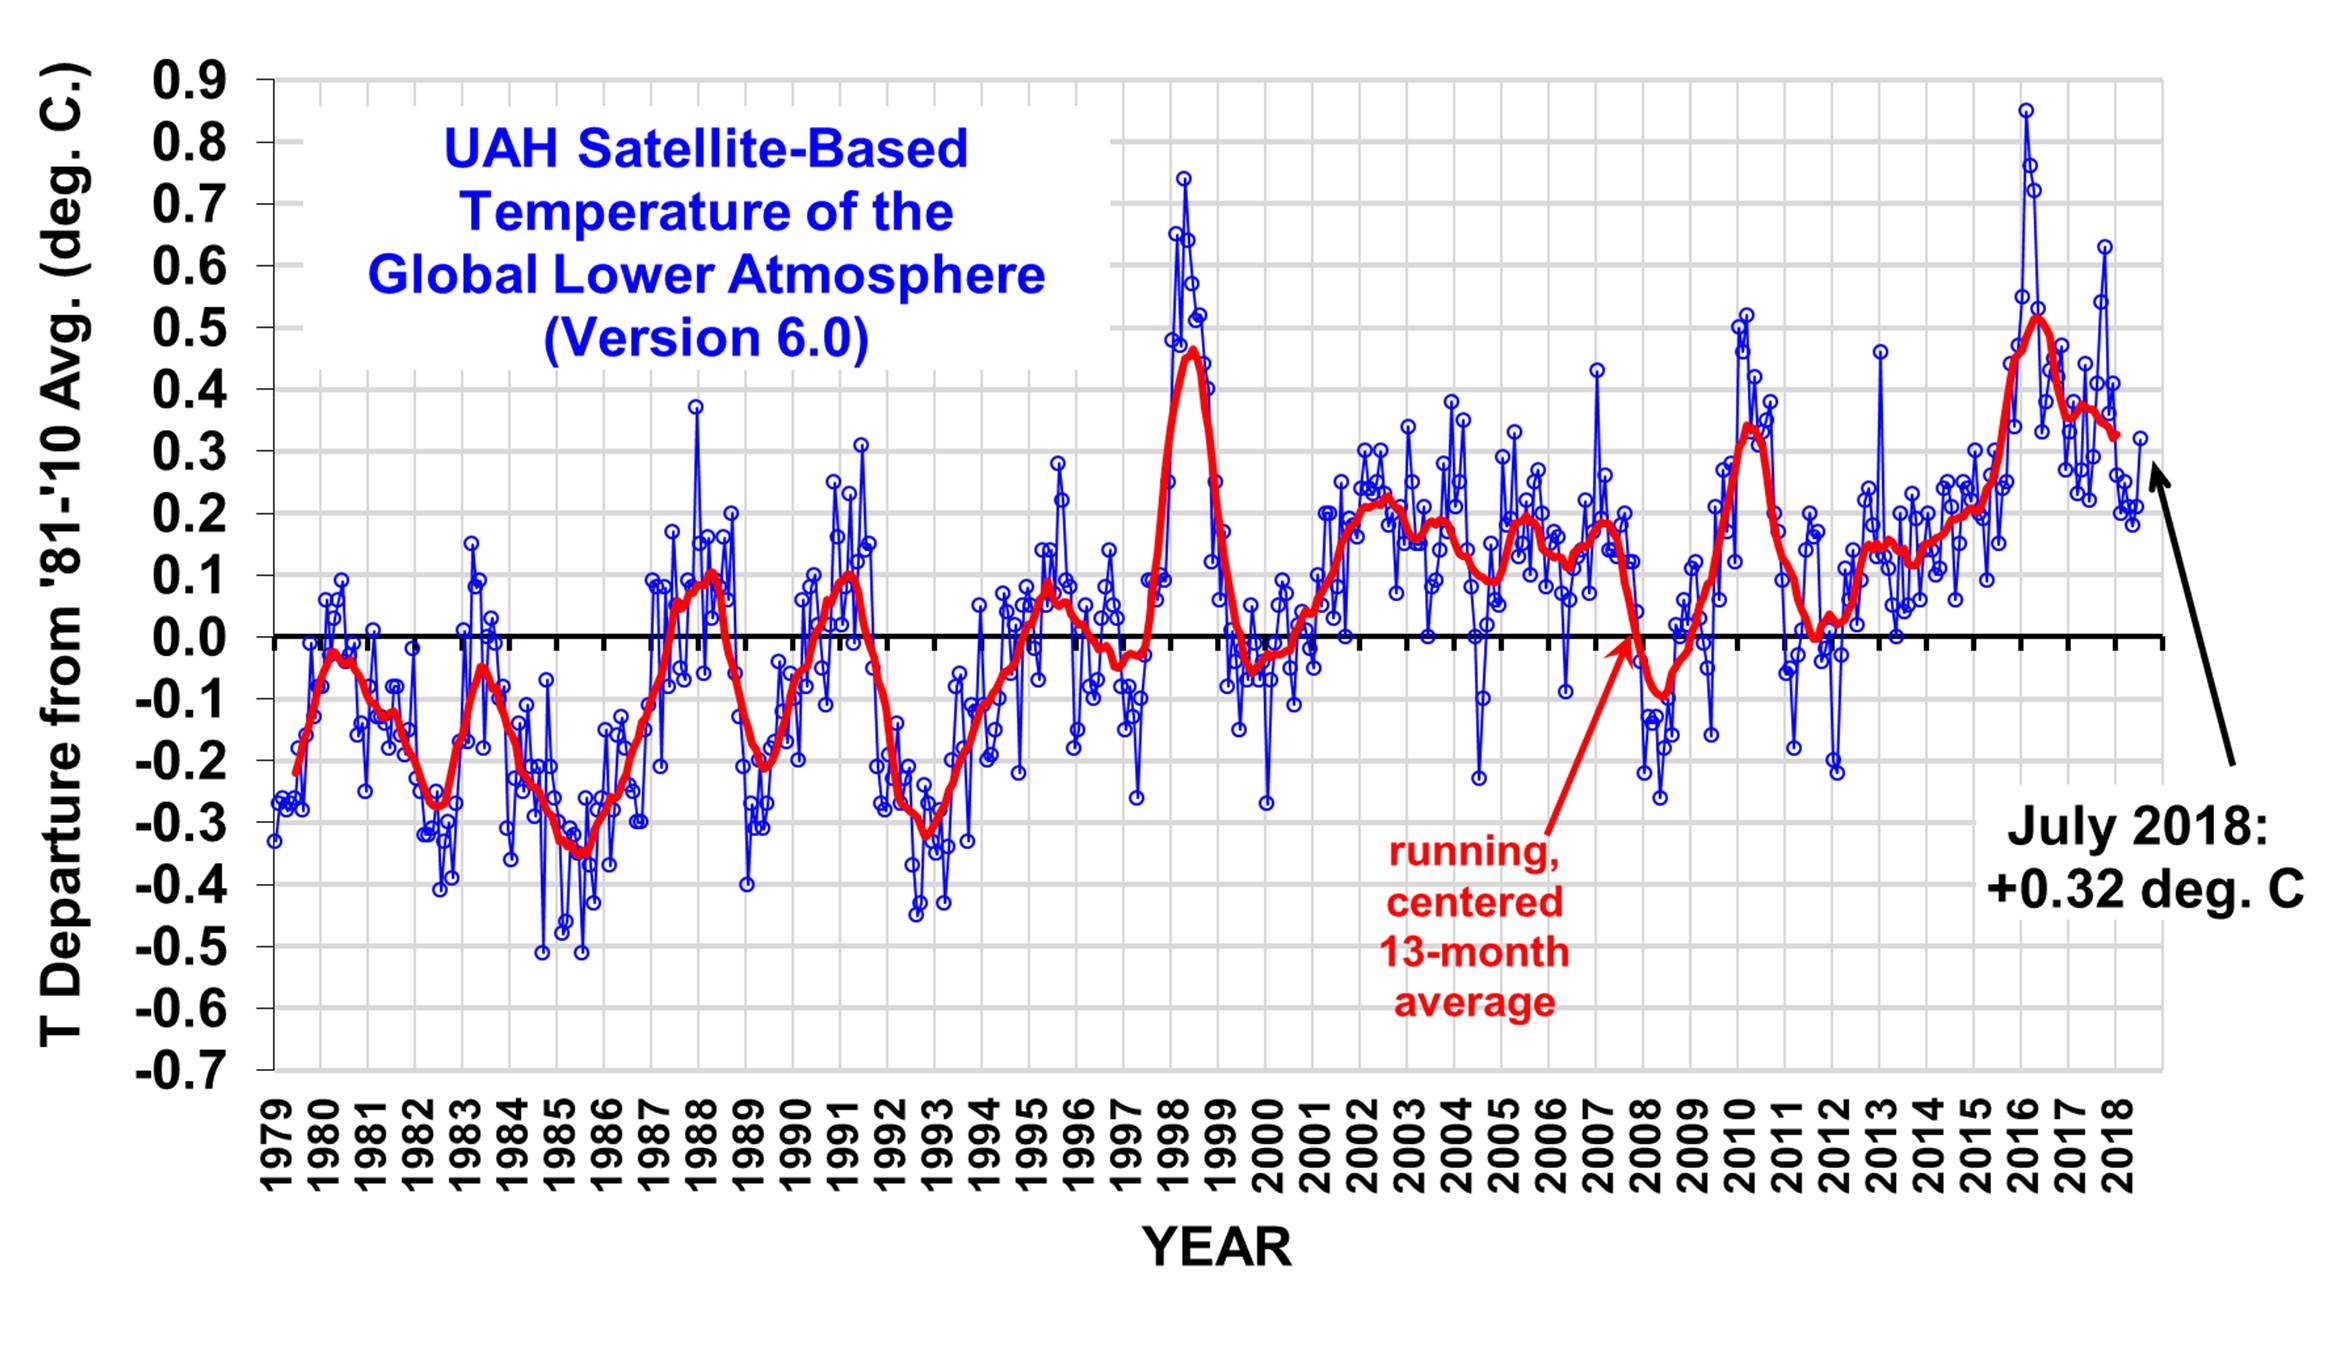
Global temperatures have plummeted since the end of the record 2015/16 El Nino, although residual heat remains:

http://www.drroyspencer.com/wp-content/uploads/UAH_LT_1979_thru_July_2018_v6.jpg
The simple reality is that global temperatures have been at a raised levels since the PDO switched in 1976. Since then the Pacific has been dominated by El Ninos.
Moreover the record El Nino of 2015/16 was not followed by a significant La Nina, which would have seen temperatures dropping further.

https://www.esrl.noaa.gov/psd/enso/mei/
Add in the fact that the AMO has been in warm phase since the mid 1990s, and it is little surprise that global temperatures are a little bit higher than the start of the satellite record in 1979.

Both PDO and AMO are wholly natural cycles, and have nothing to do with CO2 at all.
When they return to cold phase, young Joe will probably be writing about impending ice ages!
Comments are closed.

Hacks would be unlikely to earn a crust if they simply kept reporting ‘Hiatus’.
One day, the MSM will finally realise the scare stories are counter productive.
Oooh, goodie! Can I claim some compo if they turn out to have chilly summers, cold springs and autumns and even colder winters? Where do I apply? To the Mail?
Joe Public
Ah!, now, good question. But after 4 years, all bets are off of course.
The good thing is, the projections have now decreased from eternal damnation, to 4 years damnation.
It’s a start.
Young Joe P clearly hasn’t heard that we only have two years left to save the planet…
July 2017 – “Three years to safeguard our climate”
http://www.stockholmresilience.org/research/research-news/2017-07-02-three-years-to-safeguard-our-climate.html
Johan Rockström, Christiana Figueres, Hans Joachim Schellnhuber, and Stefan Rahmstorf et al
According to a religious pamphlet from former IPCC head Sir John Houghton in 2009, we had 7 years to save the planet, so our time ran out in 2016:
Click to access Briefing_18_Joseph_JTH.pdf
“Scientists predict that water in the oceans will warm faster than air above land, which increases the risks of floods, hurricanes, typhoons and cyclones worldwide.”
Yes, that’s what they have been doing since the new Ice Age global cooling stopped in 1975. They make a living predicting and politicians make a living believing them?
Paul, you said the PDO turned positive in ’76. That sounds right. But I thought it turned negative shortly after the turn of the centrury (as one would expect halfway thru the roughly 60 year cycle), giving rise to the non-ENSO hiatus. Did I miss something?
The PDO did start to turn down around then, but the latest El Nino seems to have put a dent in that.
This is not unusual, a similar thing happened around 1960:
https://www.esrl.noaa.gov/psd/cgi-bin/gcos_wgsp/tsanalysis.pl?tstype1=91&tstype2=20&year1=1900&year2=&itypea=0&axistype=1&anom=0&plotstyle=0&climo1=&climo2=&y1=&y2=&y21=&y22=&length=&lag=&iall=0&iseas=1&mon1=0&mon2=11&Submit=Calculate+Results
The DM’ s ‘science’ section has become a bit of a joke with the majority of its readers. I and many others have great fun ripping it’s fake stories by people like Joe Pinkstone and Cheyenne McDonald apart. They seem to have morphed into political and environmental activists rather than well informed and impartial reporters.
These days the last thing the legacy media do is inform.
We had the same story yesterday on RNZ:
https://www.radionz.co.nz/news/national/364121/extreme-temps-likely-to-continue-until-2022-study
” since the PDO switched in 1976 ”
The PDO is a spatial pattern and not a temperature change in the sense of + or – .
It is not the thing driving the 1976 shift, but rather a result of somelthing.
Further reading:
Bob Tisdale
Arthur J. Miller & others
Judging by the AMO graph we see it is halfway through its warm phase and so have nearer 25 years to wait before we get to the depths of it’s cold phase. So for any cooling or pause we are going to be reliant on the effects of a quieter sun, which on its own might not be enough to dampen down the climate alarmists hysteria.
J Martin
Sorry mate, but I don’t give a monkeys about climate alarmist hysteria. I’ll enjoy the warm summer we’re having (in the SE of England) the first long one since 1976, and they can go and shove it all.
Meanwhile 120,000,000 million people in developing countries will die (according to the World Health Organisation) by 2050 (32 years away) from inhaling the fumes of burning wood to cook and heat with, because they are prohibited from building coal fired power stations to provide cheap electricity, by the Paris Accord.
Nothing to do with warm summers of course, just lack of electricity.
Well NO, we are on the zero trend but bumpy top of the AMO cycle.
No telling exactly if it will have a second peak, not unusual,
or if it will start to drop, not unusual.
The mail used to be a trashy tabloid full of nonsense. Why has it suddenly gone downhill ?
At least they acknowledge that natural oceanic cycles with their high thermal capacity are significant. The leap of faith is that antropogenic activity makes it wuss and wusser..
It will be worth dragging this out in four years.
Given that similar stories appear all over the place at the same time, how much of this was actually Pinkstone’s own work anyway? Just seems like another climate propaganda office release to me.
When has crystal ball gazing become a Science ?
A comment from Australia. I have no doubt that heat waves exist and that some weather station data from some sites here show them becoming more common.
But, whenever I look at long term records from stations that are relevant to population centres, there is no heatwave problem getting worse with time.
Our Establishment propaganda relentlessly asserts that heatwaves are becoming hotter, longer and more frequent.
Overall, for Australia’s six main capital cities, this propaganda is false. There are a short few times for a site for a while when either hotter, longer or more often applies as the propaganda claims, but these cases are by far the minority. Geoff
Click to access are_heatwaves_hotter.pdf
“Scientists predict…”
That is not their job. But, “if you must forecast, forecast often.”
I read the Nature article and the only mention of hurricanes is in the abstract: ‘Accurate and reliable interannual predictions of global temperatures are key for determining the regional climate change impacts that scale with global temperature, such as precipitation extremes, severe droughts, or intense hurricane activity, for instance.’
There is no instance of the words ‘flood’, ‘wild fire’ or ‘wildfire’ in the document.
The article is about temperatures, and only that. It establishes a forecast model for the next 5-10 years, based on a number of historical records. The take-away message is:
‘Using our novel forecast system, we made interannual predictions or the future. These predictions suggest that 2018 has a high probability of having a warm anomaly (58% and 75%) compared to the forced trend, with expected anomalies of 0.02 and 0.07 K for GMT and SST, respectively.
This occurs through the significant decrease of likelihood of extreme cold events (cold
events bigger than 2 standard deviations). For the next 2 years, both GMT and SST suggest a likelihood of warm events of more than 64% and 74%, respectively. This is mostly due to an increase of the likelihood of intense warm events (between 1 and 2 standard deviations) for GMT and of extreme warm events for SST.
On even longer timecales, GMT suggests an almost perfectly balanced probability between warm and cold events, whereas SST suggests a higher probability of warm events of 69% for
2018–2022, with a dramatic increase of up to 400% for an extreme warm event likelihood.’
This is good. They made a concrete forecast, towards which it is possible to measure the model skill. Re-visit this in 2 years.
Whoo-boy…It reads as a sales-pitch. For something called PROCAST. How conceited is that – naming your methods – unless perhaps you hope to sell it commercially?
PROCAST is a bit of uni-variate time series analysis, using the venerable device, borrowed from electronics design, of transfer functions.
Inside:
– “Focusing on a 5-year mean prediction of SST*, we still have a skill for 5-year lags of
~30% [sic, the computer has laboured and brought forth a mouse] suggesting our ability to
accurately forecast part of the SST variations for the next 5 years.”
The gangs all here! Let’s go modelling!
*Sea Surface Temperature Anomalies, like these:
Which wobble all the time.
He’ll have no shame when proved wrong. Look at Wadhams and the rest of the goremannballs lot.
A whole page in the DM today, the same old rubbish, from Michael Howard this time.
http://www.dailymail.co.uk/news/article-6064961/MICHAEL-HOWARD-says-summer-proves-Margaret-Thatcher-right.html
Academics produce something trivial or speculative. The usual suspects shout, “The sky is falling!” The MSM churns the matter. Responsibility and accountability are mysteriously absent.
Old tricks are still the best. But it is very tedious to watch it unfold the same each time.
You do wonder what his former model wife ever saw in him.
Looking at the open linked document (at https://www.nature.com/articles/s41467-018-05442-8 ), this model is using NASA GISS temperature data, and SST is from the NOAA ERSSTv5 record, and then the “climate state is evaluated through the one-dimensional phase space defined by either GMT [Global Mean Temeperature*] , or SST, whereas the state transitions are based on GMT or SST evolutions simulated by climate models from the CMIP5 database (see Methods for further details)”.
*My addition in italics indicating their own definition of global-mean surface air temperature and sea surface temperature, based on transfer operators .
So you take GISS temperature records and NOAA ERSSTv5 mix in some CMIP5 and computer scroddle all the numbers to make highly dubious predictions, predictions the authors claim are very accurate. A claim made without providing any worthy evidence.
I wager them (Florian Sévellec & Sybren S. Drijfhout,) and Joe Pinkstone, that by the end of 2020 this computer model (as it stands now) will be proved wrong by weather events.
The authors, Florian Sévellec & Sybren S. Drijfhout, do have the caveat of volcanic events upsetting their highly accurate computer model’s predictions (as well as unforeseen sudden variations in aerosol and greenhouse gas emissions) — is this what they are hoping for to save them from embarrassment when the predictions fail?
The recent global warming scare seems to the result of a great deal of hard work by climate activists (they’re not ‘scientists’) at places like NASA GISS. It seems they can never make enough adjustments. Desperately cooling the past.
In May 2016 this very blog reported on the subject of wildfires in Alberta. It showed a graphic of the NASA GISS temperature data for Banff Alberta, and for good measure it provided a link to the NASA GISS source. I’m studying the Banff situation (following a pointer by ‘Steve Goddard’) and am interested in all the Banff data I can get hold of. So I clicked on the link. . . .
I soon noticed that the graph GISS are currently displaying looks very different to the one captured by this blog back in May 2016.
Sometime in the last 27 months, GISS have cooled Banff’s history pre-2007 by 1 degree Celsius.