Extra warm U.S. winter had nature’s thumbprint on it–Joe Bastardi
By Paul Homewood
Joe Bastardi explains why this winter has been so mild in the US, but also across N Europe, at CFACT:

I want you to read this article:
Two points:
1) I will make the case for why such winters like this happen
2) I will point out that nowhere in this article did the massive natural physical drivers that far outweigh the effect of CO2, which is only .041% of the atmosphere. Pointedly, of which man is only responsible for 25% and the US only 15% of that total.
I am not going to waste time attacking here, except to say this kind of one-sided journalism and the fact that nowhere did anyone show what I am about to reveal to you, should raise questions of any objective person.
Basically the rules of the game are, if its warm like this winter, its climate change, if it is cold, its climate change. It is typical of everyone gets a trophy in that any answer even if opposite, means you get credit.
I won’t copy the whole article as it is a bit technical, but it can be seen here. However these are the main points Joe raises, starting with the role of El Nino and water vapour:
Water vapor is by far the most important greenhouse gas when it comes to the planetary weather and climate. Meteorologist look at “saturation mixing ratios” which show a correlation of water vapor to temperature. Basically the colder and drier the air mass, the more the introduction of water vapor will lead higher temperatures, there is no place like the arctic to prove this is the case. The cyclically warmed oceans have put more water vapor (and CO2) into the air. When Super El Niño’s go off, the immense amounts dispersed lead to a step up of the temperature. The colder regions leading the way as will be opined on below.
.png)
Now look at the table below. Notice how small the correlated increase of WV is between -40 and -30 ( less than .1gram/kg). The introduction of those slight amounts create clouds, cause lower pressure and more turbulent mixing. All of which act to increase temperatures where its very cold. (Also in the high levels of the atmosphere, which is why the “trapping hot spot theory of warming in the upper levels over the tropics has gone the opposite way. ITS DRYING OUT NOT GETTING MORE MOIST). While its true this creates a distortion in the global temperature pattern, this is inherent in the system anyway. Notice at higher temperatures it takes much more water vapor to correlate to the temperature increase.
.png)
So look at the warming in the arctic:
.png)
The warming is in the very cold time of the year which skews the overall temp upward. Missing from this are the actual arctic temps which will still be frigid but not as low as they were in the winters 30 years ago. Still, no one is going to survive an arctic winter unless as prepared as they would have been 30 years ago. BUT THERE IS NO SUMMER WARMING meaning the amount of water vapor from the cyclically warmed oceans has little effect where it is warmer, much more when it’s cold. The fact that no such correlation chart exists for CO2 and temps should make one understand the minute effect it has on temperature anyway.
This goes to the heart of recent global warming trends, so to repeat:
1) We are seeing a double step up in global temperatures, as a direct result of the two super El Ninos, in 1998 and 2016/16.
2) El Ninos affect global temperatures by putting massive amounts of water vapour into the atmosphere
3) This water vapour has a disproportionate effect in dry regions, notable the Arctic, one of the reasons why an average global temperature is a meaningless concept.
Joe then proceeds to explain how sea surface temperatures in both the Pacific and Atlantic have been the drivers for the the mild US winter in the east this year.
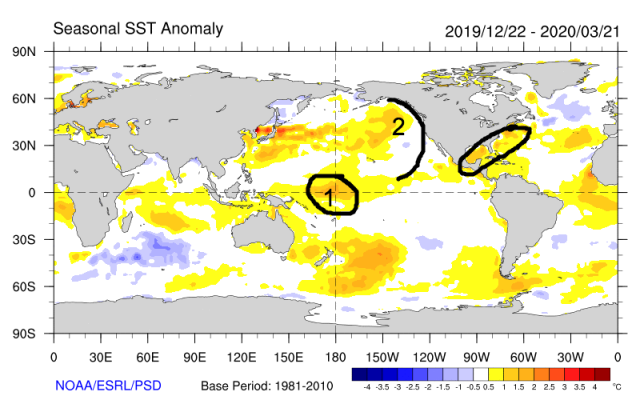
1) The warm water was near and west of the dateline. This is huge as I will explain later. 2) The water was cooler near and off the west coast than further west. 3) Warm water off the east coast, which we knew, but with no cold attacking, it was free to overtake the pattern at will.
That warm water in area 1 favors enhanced thunderstorms and the release of heat in the upper levels in a way that changes the pattern in the Pacific. If we look at the Madden Julian Oscillation, we see that favors a phase 6. Notice where the heavy precipitation is in the winter in phase 6
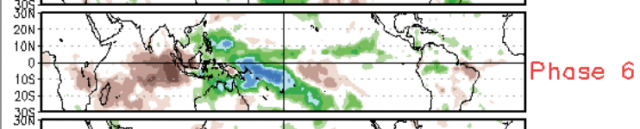
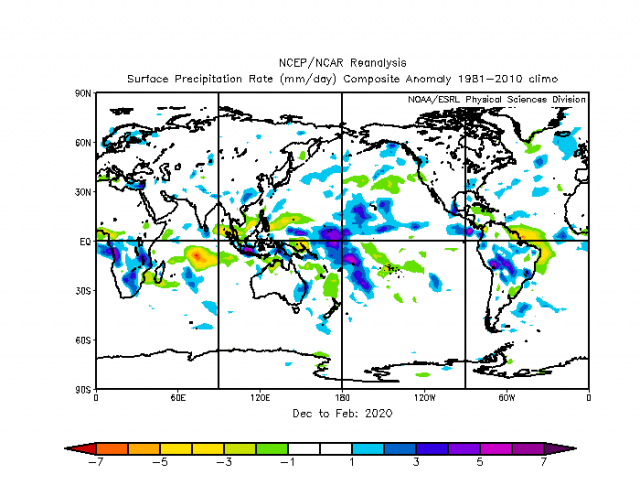
Look at this winter almost right on top of it.
What does a mean phase 6 give us for the US temperature-wise?
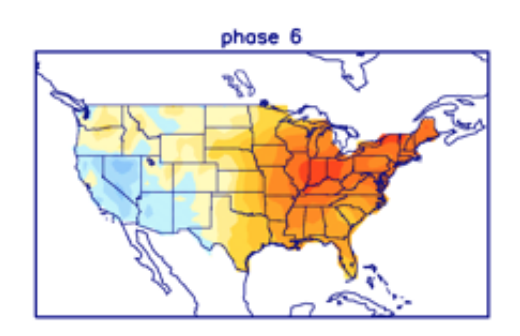
Guess what happened this winter, what phase 6 gives us. Now if this is CO2, why doesn’t it simply occur every winter? Because its not, its large scale natural forcing. Minute increases in CO2 are not going to push around the oceans, whose cycles are decades and in some cases even longer in the making.
But wait there is more. If we take the last 4 very warm winters 98-99, 2001-2002,2011-2012,2019-2020
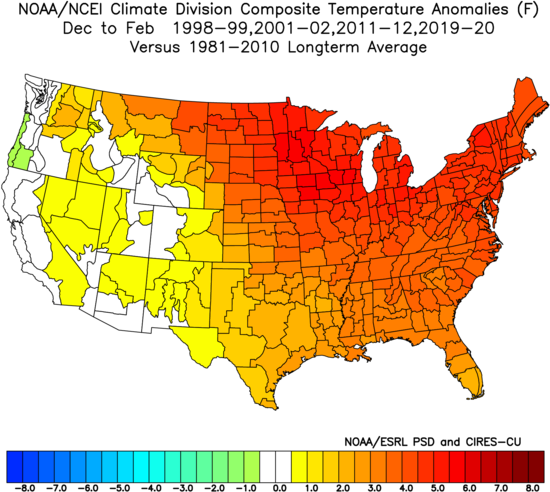
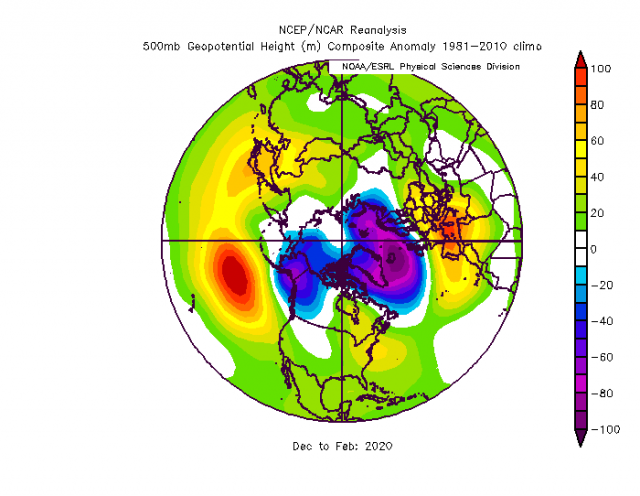
and looked at the upper air pattern, we notice a powerfully positive arctic oscillation (for the sake of ease, severe cold over the pole),
.png)
we see a positive eastern Pacific oscillation. Cold in Alaska, ridging north of Hawaii. This in turn forces ridging over the eastern US which is then fed by very warm water as it prevents cold intrusions, the ridging over Europe where it was quite warm and in much of Russia. What did we see this year?
Joe finishes by mapping out how small variations in the pattern of SSTs led to the snowmageddon in 2010.
It is a reminder that it is the oceans which drive our weather. As Joe puts it:
Minute increases in CO2 are not going to push around the oceans, whose cycles are decades and in some cases even longer in the making.
Comments are closed.

I keep posting at many sites that water vapour is the only “greenhouse gas” of any significance. Think of what happens to the temperature over a desert at night compared to that over a tropical rainforest. It s impossible to get the message across.
I camped out in the Sahara one night, and nearly got frost bite in my toes when I went for a wee!
Lucky it was only your toes!
Another thing that made this winter warmer than it might have been was the way the polar vortex sat tight over the arctic and Alaska. Joe Bastardi and his respected colleague, Joe D’Aleo, at Weatherbell, were both a little surprised we didn’t have any SSW, (Sudden Stratospheric Warming) events. These SSW will push the polar vortex down into lower latitudes and much colder temperatures for N America and Europe usually result. I want to post a chart I got from Joe D’Aleo that correlates the frequency of SSW to low solar activity and the QBO, (Quasi-biennial Ocillation) east or west phase.
It was interesting that an Ozone ‘hole’ formed in the Arctic this year.
So much for ‘fixing’ the problem (in Antarctica) with an international treaty, which the alarmists like to cite as a successful paradigm for action against climate change.
But it’s no secret it isn’t ‘fixed’ in the Antarctic, the accepted science on ozone depletion from man-made chemicals is probably substantially wrong, and China is still using outlawed chemicals anyway.
I understood it to be more about CFCs coming out of patent – so tptb wanted to change them for a new refrigerant that was in patent – and able to attract high prices for them. But then…..
https://1drv.ms/u/s!AtZb94KvQdXviutyLNDOUEh25it3rQ
Its obvious from the chart, the last twenty years of decreasing solar activity correlate with an increasing frequency of SSW events.
Man is responsible for 25 percent of co2 in atmosphere? Surely 96 percent is from natural sources and man adds the other 4 percent. China gives 28 percent of that 4 percent and UK gives 1 percent of that 4 percent.
Hello Al,
possibly he is referring to a cumulative percentage over many decades? Still the concentration if CO2 in the atmoshere is tiny and cannot be of any real significance?
The relationship between the El Nino part of ENSO cycles and “global warming” is notable but:
– it is not at all clear what causes the cycles and indeed whether we will ever be able to predict their occurrence or magnitude. And;
– the idea that large El Ninos cause “global warming” in the full sense of those words is simply, or at least largely, wrong. El Ninos redistribute heat that is already in the globe – within the Pacific Ocean to be more precise. What is “warming” is not the world as a whole but the narrow environments around the instruments on which we record temperature.
ENSO cycles are key to understanding weather patterns in the short to medium term in many parts of the world. One day I really hope that we understand what drives them.
We know Solar largely drives the ocean temperatures and that in turn drives the ocean’s currents, oscillations and cycles. We don’t understand it well at all. Geothermal contributions are not understood either. A multitude of ocean/atmospheric oscillations are affecting our weather. Many of them aren’t even observed yet. The 11-year Sunspot cycle correlates with planetary alignment of Jupiter, Venus and earth almost perfectly. Sunspot cycles correlate with increased volcanism on earth. The solar wind is greatly altered by the sunspot cycle, which in turn greatly alters the GCR count, which greatly effects cloud cover over the oceans in the tropics. We know very little.
https://www.sciencealert.com/the-sun-s-11-year-cycle-have-may-have-something-to-do-with-the-gravity-of-the-planets
What is not driving the weather is variable atmospheric CO2 concentrations. You can pretend it is if you treat solar inputs essentially as a constant – but it is wildly improbable solar inputs are constant. They are not constant, but they are so poorly understood you can pretend they are constant. The models have no skill because they rely on false assumptions, (solar is a one big false assumption).
We are having a long and glorious spring in northern West Virginia, just below the Mason-Dixon line. I am enjoying all of the wildflowers in bloom on my 5 acres which my daddy and 2 older brothers brought in and then daddy and I brought in since 1937. I even had ramps with fried potatoes one night and ramps in a great cheesy scalloped potato casserole (with bacon on top). I put the snow shovel back in the garage and mowed the 2 fields and lawn with my new garden tractor.
BTW–the only place one finds “greenhouse gases” is within the confines of a greenhouse. Otherwise these are naturally occurring “atmospheric gases.”
How does the taste of early ‘American ramps’ compare with that of ‘European summer leeks?’
I am allergic to onions, but not to the related leeks and garlic. The over-civilised human body is sometimes baffling in its behaviour.
I don’t know the comparison. However, the odor of ramps gets into your system and comes out through pores. My late mother who grew up just ca. 35 miles south of Morgantown, told of school being closed as many kids came having eaten a LOT of ramps. There are festivals here in West Virginia. The late Jim Comstock, found and editor of the “West Virginia Hillbilly” (a “weakly newspaper” as he described it), once put some ramp juice in the printer’s ink. The newspaper went all over and festered in the little heated postoffices. Jim proudly framed and displayed his letter of reprimand from the United States Postmaster General.
Our species is “Allium tricoccum”. Here is a link to Wikipedia on them. The Mt. Morris festival sign pictured is ca. 8 miles north of me at the PA line. Also, my undergraduate major professor, the late Dr. Earl L. Core, is referenced: Your species is “Allium ursinium”.
https://en.wikipedia.org/wiki/Allium_tricoccum
As a note (and a botanist), I have found Wikipedia to be an excellent source of information on a species. They give the whole classification, including order and family.
One of my sons is considering a move to the USA, and in particular to West Virginia (he is married to an American citizen and so it would be fairly easy.) He keeps sending me adverts with comments like “Fifty acres of cleared land, with mountain views, and all for $120,000!” I am not sure if ‘ramp festivals’ would add to the attraction.
I drove out from Washington D.C. to Harpers Ferry twice, as a tourist, once in December and once in July. Obviously, it was ridiculously cold the first time, and ridiculously hot the second time. In July, hikers were going past, on the Appalachian Trail; they did not seem to be enjoying themselves. The only cool thing was a snapping turtle in the Potomac River.