Sea Level Rise Is Accelerating (If You Ignore Pre 1970 Data!)
By Paul Homewood
This has to go down as one of the most fraudulent climate studies yet!
Want to know how sea level in your area is changing due to global warming and other factors? Our ‘report cards’ can help. Updated by the Virginia Institute of Marine Science each year as annual tide-gauge data become available, they display recent sea-level trends and project sea-level height to the year 2050 for 32 localities along the U.S. East, Gulf, West, and Alaskan coasts.
Report Card Components
Our report cards have 3 components: the 2050 projection, recent trends in the rates of sea-level change, and an explanation of processes affecting sea level at each locality.
The annotated chart below, using the latest data from Norfolk, Virginia, briefly explains the data and statistical approaches we use in our 2050 projections. Visit an individual locality for details on all its report-card components. You can also compare sea-level trends, projections and processes among localities and by region. For full technical details, read our report.
https://www.vims.edu/research/products/slrc/index.php
Let me tell you why.
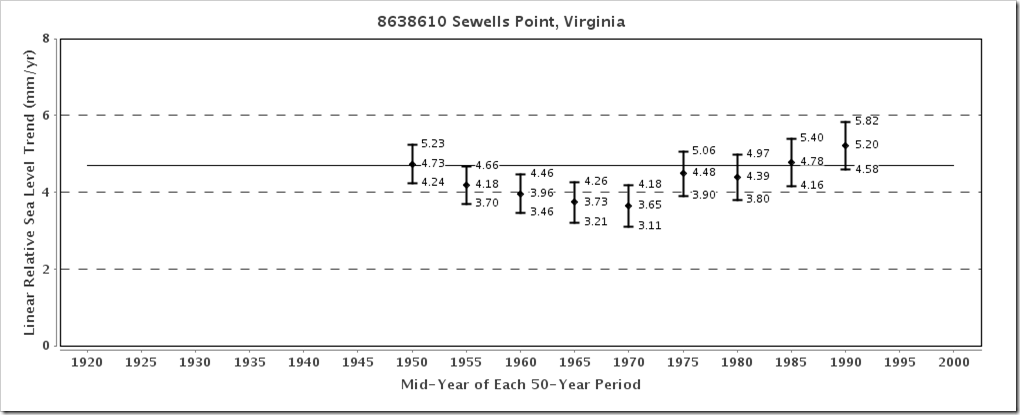
Below is the actual tide gauge record for Norfolk, Virginia (Sewells Point), which is the Anyport example used.
https://tidesandcurrents.noaa.gov/sltrends/sltrends_station.shtml?id=8638610
It is clearly difficult to see any signs of acceleration there. But look closer – the record starts in 1927, so why does the VIMS Report Card begin in 1969?
Indeed, this is not just a one off. As their Abstract states, all of the calculations in their study begin in 1969, despite much longer data records at most US sites:
https://scholarworks.wm.edu/reports/1111/
This is also confirmed in their Press Release, which states:
The team’s web-based report cards project sea level to the year 2050. The analysis now includes 51 years of water-level observations, from January 1969 through December 2019. The interactive charts by locality are available online at www.vims.edu/sealevelreportcards.
But why should this choice of dates matter?
Let’s look at New York, which has one of the longest running gauges:
https://tidesandcurrents.noaa.gov/sltrends/sltrends_station.shtml?id=8518750
Again, there is no long term acceleration. But NOAA also chart 50-year running trends.
This shows that the rate of sea level rise rose in the first half of the 20thC, peaking at 3.86mm/yr in 1950. (Bear in mind, these are mid point trends, so the peak was 1925 to 1975).
Following that, sea level rise slowed until 1970, before rising again. However, the current rate of 3.38mm/yr is still less than that earlier mid 20thC peak.
In other words, they have cherrypicked their starting point to coincide with the slowdown at a time of global cooling. As sea level rise returned to earlier levels, it is inevitable that this would create an artificial acceleration.
https://tidesandcurrents.noaa.gov/sltrends/sltrends_station.shtml?id=8518750
If the VIMS study had included all of the available data, it would have been forced to conclude that sea level rise had not accelerated since the early 20thC.
Does any of this matter?
VIMS then goes on to extrapolate from the acceleration since 1969, projecting sea levels to be 370mm higher in 2050 than 1992 – an annual rate of 6.38mm, effectively double the current rate.
https://www.vims.edu/research/products/slrc/localities/nyny/index.php
But from a statistical viewpoint, there is no basis for this assumption. You might just as well chart UK temperatures from January to June, and then claim that they will carry on rising at the same rate.
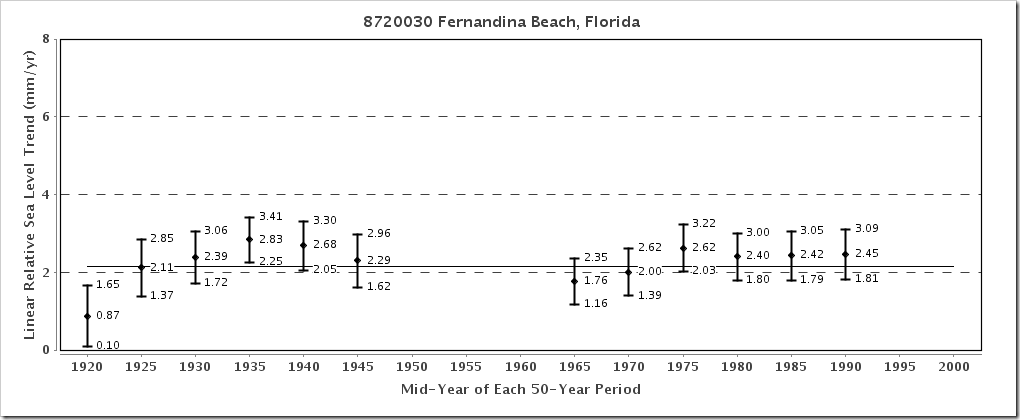
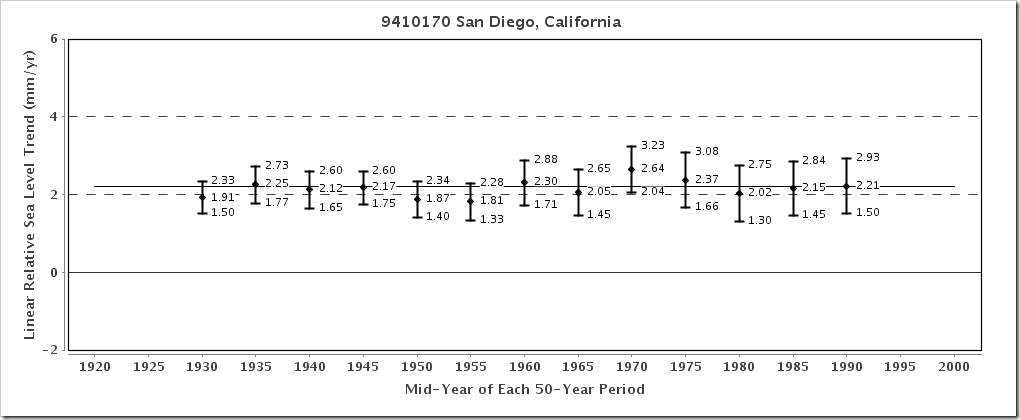
This pattern of a slowdown in sea level rise post 1950 and then a return to earlier levels exists at all US sites, and on all coasts:
https://tidesandcurrents.noaa.gov/sltrends/sltrends_us.html
I don’t have a crystal ball and don’t claim to know what sea levels will be in thirty years time.
But this exercise is plainly not fit for purpose, and was presumably published with the sole intention of creating false alarm.
Comments are closed.


Hello Paul,
Just want to say, well done for exposing all the lies on a daily basis.
I really enjoy your blog. It is tragic that so many of the population have been brainwashed now to the point where they are unable to think for themselves. Let us hope that sites such as yours will soon make a difference before we have to give up our civilisation.
Regards, Mike >
As per the IPCC you could say that “there is a high probability that sea level rises will continue on their average linear rise-rate of below 2 mm/year”.
Any mention of sea level rise due to the Chesapeake bolide? That area is sliding back into a 35M year old hole.
The chart describes the decadal signal as “Changes in sea level due to ocean-atmosphere interactions like El-Nino…”
How does El-Nino raise the global sea level? Does La-Nina lower it? Both are natural.
I understand that La Nina increases rainfall over Australia and other lands, thus moving water from sea to land, but only temporarily obviously
Obama recently bought a big spread in the Hamptons on Long Island so I guess it is not as bad as the new age prognosticators think.
Actually, the Obama’s bought an estate on Martha’s Vineyard for $11 million +/-. It is on the coast of the island with an average of 3 feet above sea level. As with the other climate change hypocrites, they continue to preach the coming horrors from climate change while living a different story.
Do hope the WAIS is really unstable with all those volcanoes…..
Worst president ever. Dumber than a rock.
We live at 682,752 mm above sea level [ 2,240 ft. ].
If the sea is rising at 3.38 mm/year, I’m going to wait a few more years before I panic.
– – winking smiley face – – Poe’s Law
Even the IPCC AR5 shows the rate of change of sea level now is not unprecedented over the last 100 years or so. If you check out the following link:
https://www.ipcc.ch/report/ar5/wg1/sea-level-change/
And then click Fig 13.7 (chapter 13, Figure 7) in the graphics and then look at Panel B you will see the three “IPCC Approved” sea level rate change curves. Jevrejeva 2008 (plum) is now superseded by J2014 but is pretty much the same over the time period shown and clearly shows sea level acceleration peaked around 1955. Church & White (blue) clearly shows two prior periods similar to the latest period and Ray and Douglas (green) clearly has a peak acceleration around 1945, similar to today.
If you compare the rate change of Jevrejeva 2014 to Hadcrut4 in a 30 year moving window, they are very similar oscillations evident with a period of about 70 years. The time lag between sea level and temperature is about 16 years. Taking this lag out, the correlation of sea level rise with temperature over the C20th is about 0.92.
Now supposing they had done this in ’99 and used a 30 year period, just imagine the hockey stick projection they would have got. However the intervening couple of decades would have dragged that down and made a mockery of a ’99 projection.
I cannot think of any good reason why weather professionals would predict on the basis of continuing trends when most whether phenomena appear to be broadly cyclical over differing periods.
Is somebody going to contact the authors and ask them why they did not use the complete dataset?
Reckon they’ll bother to reply?
It’s difficult to actually define what sea level is, anyway: it depends on water temperature, salinity, atmospheric pressure, wind strength and direction, and the rate of rotation of the various “gyres” – faster rotation means higher at the edges (the coast), lower in the middle. And bear in mind that sea level at either end of the Panama Canal (and probably also the Suez Canal) is different. And the Mediterranean and North Sea are about half a metre different according to survey data between the two – witness the famous 54cm height difference between the two sides of the German/Swiss Laufenburg Bridge.
Fascinating story, apparently the sea level difference for the Baltic and Mediterranean Seas is 270mm but in making the necessary correction someone used the wrong sign — oh dear!
http://themetricmaven.com/?p=8591
Not Baltic -> North Sea.
The land at the north of the Baltic is rising so the sea is retreating. Saw this on a TV programme years ago citing the land still rising from the last ice age. This would never be covered these days.
This one is actually so easy to debunk, I am amazed that there are still people believing the rising sea levels storyline. Look at the island of Nantucket. Found it in Google maps? OK, now look at a very old map from Nantucket. The following one is more than 250 years old. Now compare it with your google maps image. Everything there down to the last sandbank. You can do that on countless locations if you can find old, accurate maps from those places and nature has not been tampered with. Also, look where oranges grow in the US about 100 years ago and look how far south the limit has gone. It got colder since then. When will we start to be serious? http://www.old-maps.com/ma/ma_NantucketMaps/Nantucket_1775_Blask_web?utm_source=Pinterest&utm_medium=Social
People believe the rising sea levels storyline because they only get their information from the mendacious MSM and media. Anyhow, where is all this extra water supposed to be coming from?
This was a favourite topic of the late John Daly:
Still Waiting For Greenhouse, http://www.john-daly.com/deadisle/
And if this fake sea level rises affect the UK as well then these cost will go up …
UK offshore wind decommissioning costs already at £4bn
https://www.energyvoice.com/oilandgas/decom/212865/uk-offshore-wind-decommissioning-costs-already-at-4bn-2/
The most important factor is that there is no observable connection between the rise of CO2 and the rate of rise of sea level, see
http://sealevel.info/MSL_graph.php?id=8518750
I’ve used this evidence many times now with individuals and organisations because it’s a very easy concept to grasp, unlike most of climate science. It’s a very useful counter to the equally simple ‘97%’ appeal to authority. Yes I know the latter is fraudulent, but you’re not going to persuade anyone of that in an elevator speech are you?
Push back with just one indisputable fact, and do it regularly, it’s what the alarmist persuasion model is based upon.
I have a new name for climate alarmists, it’s a spin on their tired old chestnut climate denier phrase they use for us realists. I’ll called them natural phenomenon deniers from now on because that’s clearly what they are and I think it’s a poignant reposte!
Off topic – sorry – but I have just noted that the Nevada solar “tower of power” plant at Tonopah has gone bankrupt and shut down taking 3/4 million Obama dollars with it !
https://www.reviewjournal.com/opinion/letters/letter-much-touted-crescent-dunes-solar-plant-goes-bust-1935510/
https://techstartups.com/2020/01/06/1-billion-solar-plant-obsolete-ever-went-online/
.75 billion I think, not million. ( Plus decommission costs)
taxpayers money of course
Cherry picking is usually tasty but this one is most distasteful. As an example, for New York (The Battery) the 51-year 1969-2019 linear trend was 3.57 mm/y. However for the preceding 51 years (1918-1968) the linear trend was almost the same (3.40 mm/y). Using the full record, 1856-2019, the linear trend was 2.82 mm/y.
It is all very similar to a recent example in Australia:
Does acceleration prove human cause?
https://tambonthongchai.com/2019/02/20/csiroslr/
If so, then who were the humans responsible for accelerated sea level rise in the previous interglacial?
https://tambonthongchai.com/2018/12/21/eemian/
This description, from 1929 [sic], by the Secretary of the American Meteorology Society (when it was a fresh young organization):
ftp://ftp.library.noaa.gov/docs.lib/htdocs/rescue/whytheweather/1929/19290125.pdf
indicates, perhaps, the real cause of the slow steady increase.
The next time anybody says that an unprecedented chunk of Antarctica just fell off…
Thank you for this Dave. Really appreciate receiving information like this. Khob khun khraap.
The whole collection of these factual, educative, articles is worth spending time with:
https://www.library.noaa.gov/Collections/Digital-Collections/Why-the-Weather
They were written by three men over the two decades between the World Wars. I actually misattributed the one about Antarctic ice-bergs. It was written by the “Meteorologist in Charge of the Library of the American Meteorology Society.” In another place ,he mentions that the Library contains fifty thousand books!
The natural context is everything, current rise….. pffffft nothing odd.
Did anyone watch ITV’s programme about Harry Redknapp’s home at Sandbanks yesterday? Multimillion pound residences selling like hot cakes – a few feet above sea level but with no discernible change. Are we to suppose that these multi-millionaires are all stupid? But, more seriously, we are still complaining to ourselves and the message of sanity is just not getting out there. I write occasionally (i.e. not bombarding him) to my MP but after the first couple of times (he is one of the newbys) he just ignores me. It is only when these people get the same message over and over again will they start to listen. So get to it everyone.
My main complaint with their statistics is different, and I would consider a more serious problem than the cherry-picking you pick up. I’ve had a look at the actual paper to look in more detail at the stats and how they report it.
The biggest problem comes from the fact that they have arbitrarily used a quadratic functional form, ie a + bx + cx^2, to model the apparent curvature in the post-1970 trend, without any appreciation of the issues that raises. They guess there is a non-linearity, so they just throw in a quadratic term as an entirely arbitrary choice, to pick up that non-linearity But they have no good reason to suppose that they are modelling a quadratic process. Their statistical technique draws a pretty line through their data. But it has no use for projection at dates outside the data area, as we have absolutely no grounds for believing that the underlying process is a quadratic process, and thus that will behave like that outside the data period. For example, we know as fact that an acceleration in sea-level rise cannot be maintained indefinitely as there is only so much water on earth, so there are a priori reasons for knowing that it is not a quadratic process in the longer term. Nor would it work as a back-cast on the pre-1970 data – so there’s a warning for them.
Their statistical sophistication is so lacking that they fail to report any goodness of fit statistics for the equations they estimate. That would have been an automatic fail for your masters thesis where I studied, and indeed automatic rejection by any competent academic journal.
On the issue of cherry-picking, there can be good grounds for separately analysing time-series data in (eg) two periods, if what is happening is different in the two time periods. But they do not establish whether those grounds exist. There is a statistical test for that, and needless to say they do not mention doing it.
This a good point – even the Jevrejeva 2014 sea level paper tries to convince there is “acceleration” by fitting a 2nd order polynomial. However, the curvature arises because the earliest part of the data has a negative slope, not because the later part has a positive accelerating slope. The stupidity of claiming “acceleration” is easily demonstrated then – omitting the early part of the data set and refitting the curve shows the 2nd order polynomial is identical to a linear fit once the early negative slope data is omitted.
An x^2 term in a polynomial does not really relate to “acceleration” at all. A curve in the form of x^2 is of course a “U”-shaped curve. Anytime you see evidence of “acceleration” claimed by fitting a polynomial with an x^2 term you can be certain its nonsense. Extending the curve both forwards and backwards it will be U-shaped and clearly inappropriate as a fit.
How it has become established in Climate Science that a 2nd order polynomial is evidence of acceleration is just beyond me. And also beyond me is the fact that no-one seems to call it out as bollocks.
PS I should have added the point that the best way to detect acceleration is compute the linear slope in a moving window eg 30 years. But of course they tend not to do that in Climate Science because longer-term periodic behaviour then becomes blindingly obvious – like the quasi-70 year periodicity in both temperature and sea level data – in the sea level case indicating sea level rate change in the 1950s as high as present day, before they dropped back during the 1960s-1970s (at the bottom of the cycle).
Nicky Campbell was still promulgating the Maldives myth this morning.
“Well, the trouble with our liberal friends is not that they’re ignorant; it’s just that they know so much that isn’t so.” RR
They based their study on a single site? And that single site just happened to be at Norfolk VA on the banks of Chesapeake Bay? That’s not bad science, it’s ‘hilarious science’.
I’ll start believing sea-level studies when they place an accurate GPS right on top of each sea-level gauge.
(SONEL are doing something a bit like this https://www.sonel.org/ But there’s a problem . . . their GPS is often several kilometres away from the sea-level gauge – which gives rise to some weird results like this . . . https://www.sonel.org/-Sea-level-trends-.html?lang=en (click on Antofagasta, Chile)