Longwave Radiation & The Arctic
By Paul Homewood
One of the White House Climate Change Information Briefs is this one by Dr William Happer. It does not aim to make new science – it merely gives a layman’s view of the topic:

https://www.drroyspencer.com/wp-content/uploads/Radiation-Transfer.pdf
It has some relevance to David Coe’s recent posting on the subject.
However, there is one section which I want to draw your attention to. What follows is a discussion of some of the implications that arise. They are very much my interpretation, and I may be wrong, so feel free to criticise!

There are two things I want you to notice:
1) Outgoing thermal radiation peaks at around 200 latitude, the horse latitudes, such as the Sahara, where the air is very dry.
2) Thermal radiation to space exceeds incoming solar energy from around 400 latitudes and higher, whilst the opposite is true at lower latitudes.
The Earth is in fact extremely efficient in transferring this surplus energy out to the polar regions, and thus maintain balance and a moderate climate. It does this through a combination of ocean currents, winds and evaporation.
It is assumed that extra CO2 in the atmosphere will reduce the amount of energy, which the planet can radiate to space. However, the above graph suggests that the polar regions are not limited in this way, and are capable of radiating much more energy to space, assuming such energy was present there in the first place.
And, of course, that extra energy is present there. We only have to look at atmospheric temperatures in the Arctic to see that. We often hear how the Arctic is warming twice as fast as the rest of the planet, but what happens to that heat? It is radiated to space.
Indeed there is little to keep it back, as there is so little water vapour there. Indeed there is no obvious reason why outgoing radiation at the poles should not be at similar levels to the horse latitudes. The only limitation is the amount of heat at the former in the first place.
A warmer Arctic is not a sign of a warmer planet, it is evidence that the planet is losing more heat to space.
Let’s test this out with a few charts.
Temperature data in Iceland shows that it was just as warm in the 1930s and 40s as now, but there was a long, intensely cold era in between, which lasted about 30 years.
Clearly these temperature trends cannot be explained by CO2, which at best can only be a minor driver of temperatures there.
We do, of course, find exactly the same pattern of temperatures across most of the Arctic.
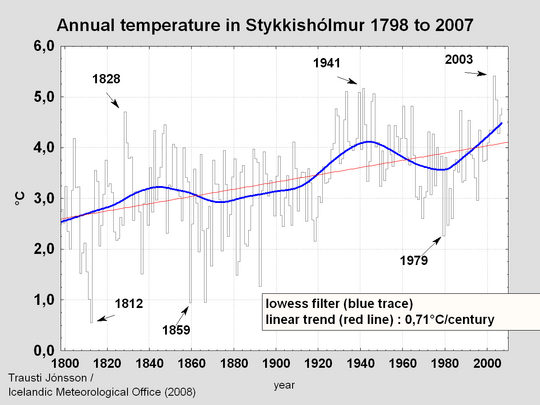
Annual temperatures trends at Stykkisholmur, Iceland – Icelandic Met Office
https://en.vedur.is/climatology/articles/nr/1213
Secondly, let’s look at the diurnal temperature variation at Akureyri, which is on Iceland’s north coast. This is the difference between daily max and min temperatures.

https://en.vedur.is/climatology/data/#aa
As we can see the biggest differences are between April and August. This tells us that as days warm, outgoing radiation at night increases to compensate.
We often hear claims that less sea ice reduces the albedo effect, allowing more solar radiation to enter the ocean. This may be a factor, but in reality in mid summer, when solar radiation is at its maximum, Arctic sea ice extent is still close to full:

http://ocean.dmi.dk/arctic/icethickness/thk.uk.php
When sea ice extent hits minimum in September, solar energy is already rapidly diminishing in the Arctic, and the loss of heat from the ocean becomes the dominant factor.
Comments are closed.

This is interesting:
“Atmospheric concentrations of carbon dioxide, methane, nitrous oxide and other greenhouse gases are slowly increasing.”
Pardon a paraphrase:
First they came for the CO2 and I said and did nothing. Then they came for the methane. I still said and did nothing. Then they came for the nitrous oxide and I said and did nothing. Then they came for the water vapour and I still said and did nothing to resist them. Next they came for the oxygen.
Sound effect thuds . . . . as human bodies collapse to the floor.
Paul H says, “However, there is one section which I want to draw your attention to. What follows is a discussion of some of the implications that arise. They are very much my interpretation, and I may be wrong, so feel free to criticise!”
Liked… We should all say that more.
Regarding the movement of heat within the system to its finale exit to space, it appears obvious that added energy to the water cycle and to the convection cycle on earth is a negative feedback to increased energy, as accelerating said process reduces residence time of energy within the system.
I have a problem with heat fluxes because not all Watts are created equal.
1Watt of solar energy can do WORK at the surface.
1 Watt of DWLWIR from tropospheric CO2 can do nothing at the surface, ask a climate expert why.
This comes back to electron volts, solar has lots and DWLWIR as very little
I hear ya, A.C.,
If you want to have fun, call on the Duke of DownEllington.
But, if you have an important job to get done, rely on the Duke of DownWellington
https://www.historytoday.com/archive/british_prime_ministers/duke-wellington
There is truth in that AC. I made exactly that statement to Willis once. The principle was the same as what you are suggesting, yet partially in a different, or added context.
“Only two things can affect the energy content of a system in a radiative balance, either a change in the input, or a change in the residence time of the energy entering the system.”
Followed by the corralary…
“The residence time of energy entering the system is determined by the wavelength of said energy, and the disparate materials said energy encounters.”
So yes, one photon of SW solar radiation near the equator striking a cloud may instantly reflect much of its energy back to space, having a very short residence time, or, under clear sky’s, the same photon may strike clear ocean water, and may penetrate the ocean for up to 800′, and the energy imparted could stay within the oceans for decades, even centuries. Indeed, over a 365 day period if cloud cover is net reduced, then every day of that reduction is acumalated net energy gain into the oceans. Since overturning of ocean energy can take up to a 1000 years, said energy, lost to the atmosphere for that time, may not impact atmospheric T for centuries. Yet energy can never be lost or destroyed.
In the SH summer, the earth receives an additional 90 watts per sq’meter of TSI, absolutely dwarfing any of the one or two watt per sq meter GHE. Yet the GAT decreases!
Yes, we all know the NH landmass snow cover expands greatly, increasing the albedo, thus decreasing energy input residence time, yet also much of that extra SH summer TSI enters into the S.H. oceans, and is also lost to the atmosphere for days, weeks, months, and possibly many years. The question is; is the Earth’s system, land, oceans atmosphere, net gaining or losing energy during the S.H. summer?
For a bit more along this line read here…
Here…
and here where you exact message regarding “not all watts are created equal” and David on, in the comment just below this link, who knows vastly more science and math then I, somewhat concedes what we are trying to articulate…
Another big factor is cloud cover at night which makes a big difference to the loss of heat. Presumably there is little cloud in the Arctic and Antarctic as the air is so cold that it can hold very little water vapour. Another major factor must be wind which would move the cold air away. Still nights are colder than windy ones. So much that we don’t fully understand and cannot measure accurately. This is what makes it an easy target for speculative scientists.
Link doesn’t work. HLP
Try here:
AC Osborne, DWLR you say? how about plain English? Yes we know you are a big brain and even bigger ego but stoop down to the level of ordinary humans. Your God like self will be the better for it.
When you show the courtesy of spelling my name correctly I might consider answering your apparent question.
You can also lay off the ad homs.
@A C OSBORN
Aren’t you the fortunate one to have jonnysnow for a spiritual advisor! 😦
Driving While License Revoked …. HAHAHAHA !
Excuse me John Snow but your comment is rude, uncalled for, and rather juvenile. Show respect or go elsewhere.
Sorry, I get a bit fed up with these acronyms which do not explain but obfuscate. I like plain speaking which is also a courtesy. Some of these arguments need to be slimmed down to give to the average punter (Like me) we are the people we need to convince after all?
Downwelling long wave radiation.
AKA, the greenhouse affect, or backradiation.
What is evident here is that the poles do not emit more radiation than the tropics they emit less because they are colder. The poles are cold because the receive less radiation than the tropics they do not get all this heat from the tropics and throw it all back into space and become cold, if heat is transferred to the poles than the earth heats up.
Sorry Donald, you dont make sense. If atmosphere is uniform(why isnt it?) then It should absorb and emit equally everywhere. The paper says that heat moves laterally around the planet (we know this is true just experience a wind direction change). So high heat zones (the tropics) will convect and conduct heat to lower heat zones where it will be emitted equally. Of course the big regulators are the insulating clouds and atmospheric moisture. CO2 will be equally irrelevant everywhere in the transmission of heat.
I am thinking of the surface being colder at the poles than the tropics. The atmosphere warms up and cools down due to weather patterns of course.
Physics comes into it with ‘black body radiation’ does it not? Poles are ice-covered so radiate less efficiently. If they were painted black they would radiate more heat but that would really get the ice melting on a sunny day and the environmentalists and polar bears would all have nervous breakdowns. Can’t have that.
Is it not the reduced radiation at the poles – compared to warmer climes closer to the Equator – that drives the winds and, hence, the weather patterns?
Sooner or later, the environmentalists are going to have to accept that our home in the universe really is a ‘Goldilocks’ planet.
VERY NICE!
but… just a minor nitpick. You have the DMI figure for “ice thickness” aka “ice volume,” but you refer to “ice extent.” While that probably doesn’t affect the conclusions significantly, if at all, it’s a detail that could be easily remedied.
Yes, it’s the map I am referring to though, the graph is part of the image
There is a killer bullet to shut the carbon dioxide warming hoaxers’ mouths; 15 micron radiation is not heat! https://www.quora.com/Does-one-body-at-lower-temperature-than-the-surroundings-still-emit-thermal-energy-through-radiation/answer/TL-Winslow
A very interesting temperature analysis from the experts in this field. Learned a lot. Thank you.
But in terms of global warming, which is the issue in the climate movement, what we see in the UAH data is a sustained rise in global mean surface temperature at rates ranging from 0.011C to 0.016C per year across the 12 calendar months.
What that means is global warming.
Sorry that’s the wrong link but I do have a post on the uah temperatures that shows those warming trends in the period 1979 to 2020.
Sure, from 1979 when the scientists predicted global cooling and the imminent arrival of the next ice age. Try a graph from 1935 to 2020 using raw data and then wonder what the fuss is all about. Try another one with ‘adjusted’ data and wonder what modern science can achieve.
Did not know that they had predicted cooling during a time of rising atmosCO2. Thank you for that information. I will look that up.
Also please look at the annual artic location T graphic, and the 1979 arrow! Yes, that was the peak of the Ice Age Scare, and also the time point for most “scarry” CAGW charts.
They have worked hard since to not just hide the decline, but to erase it.
I have written about that cooling anomaly
https://tambonthongchai.com/2018/10/23/the-1970s-cooling-anomaly-of-agw/
My analysis of warming from 1979 to 2020, is the period since the end of that 30 year cooling period.
https://tambonthongchai.com/2018/10/23/the-1970s-cooling-anomaly-of-agw/
The issue is time. Temperatures may be rising. But they have fallen, risen, fallen, risen across thousands of years and probably millions of years. Quite why we should believe it has been wholly natural in the past but isn’t now is beyond me.
Yes sir. In statistics they call it the data selection bias.
https://tambonthongchai.com/2020/10/09/a-data-selection-bias/
less sea ice reduces the albedo effect, allowing more solar radiation to enter the ocean.
But the areas with most sea ice are at high latitudes where the sun is at a low angle, limiting the radiation into the ocean – which is why they had sea ice anyway. Some of the radiation just reflects off the water according to the latitude, so is still part of the albedo effect.
Its an interesting point you raise old brew, and is another area where vast assumptions are made. They assume a blanket solar radiation input to earth ignoring the enormous variances and reflections. I dont know if photons ricochet like an object with mass. A bullet,bomb,stone is 90% likely to ricochet if impacting a surface at a 10deg or less striking angle, but is 90% likely to penetrate if impacting at 30deg or more. A ricochet is more likely off a calm surface (ocean) than a turbulant surface. I’ve never seen the ricochet effect factored in for the small grazing angles of light received on the oceans and flat ice of polar regions.
Anyone confused should go skim some stones on a lake.
I remember reading a couple of articles by a chap who was researching heat movement from the equator to the polar regions (something to do with heat cells and Roseby waves), and the possibility that the ozone hole detected over the both poles were possibly part of this heat dissipation system, the holes were larger when more heat needed to be ejected out of the earths atmosphere, and reduced in size when there was less.
I can’t remember his surname, but I think his first name was either Stephen or Andrew.
Does anyone on here know in what year the UN and its IPCC decided that nitrous oxide was a Global Warming Gas? I ask because I heard it for, I think, the first time on BBC R4 News this week plus Dr William Happer has included it in the first sentence of his Introduction.
It seems to me that new gases are being added regularly to the Boogymen list of Warmers.
Arctic warming happens when the solar wind is weaker and increases negative NAO/AO conditions. That allows more warm humidity events into the Arctic, and it drives warmer AMO anomalies.