Climate Alarmists Invent New Excuse: The Satellites Are Lying
By Paul Homewood

Dellers on the climate alarmists latest desperate attempt to keep their scam going:
The climate alarmists have come up with a brilliant new excuse to explain why there has been no “global warming” for nearly 19 years.
Turns out the satellite data is lying.
And to prove it they’ve come up with a glossy new video starring such entirely trustworthy and not at all biased climate experts as Michael “Hockey Stick” Mann , Kevin “Travesty” Trenberth and Ben Santer. (All of these paragons of scientific rectitude feature heavily in the Climategate emails)
The video is well produced and cleverly constructed – designed to look measured and reasonable rather than yet another shoddy hit job in the ongoing climate wars.
Sundry “experts”, adopting a tone of “more in sorrow than anger” gently express their reservations about the reliability of the satellite data which, right up until the release of this video, has generally been accepted as the most accurate gauge of global temperatures.
This accuracy was acknowledged 25 years ago by NASA, which said that “satellite analysis of the upper atmosphere is more accurate, and should be adopted as the standard way to monitor temperature change.”
More recently, though, climate alarmists have grown increasingly resentful of the satellite temperature record because of its pesky refusal to show the warming trend they’d like it to show. Instead of warming, the RSS and UAH satellite data shows that the earth’s temperatures have remained flat for over 18 years – the so-called “Pause.”
Hence the alarmists’ preference for the land- and sea-based temperature datasets which do show a warming trend – especially after the raw data has been adjusted in the right direction. Climate realists, however, counter that these records have all the integrity of Enron’s accounting system or of Hillary’s word on what really happened in Benghazi.
Given the embarrassment the satellite data has been causing alarmists in recent years – most recently at the Sen. Ted Cruz (R-TX)97%“Data or Dogma” hearing last December – it was almost inevitable that sooner or later they would try to discredit it.
In the video, the line taken by the alarmists is that the satellite records too have been subject to dishonest adjustments and that the satellites have given a misleading impression of global temperature because of the way their orbital position changes over time.
These sound plausible criticisms till you look at this graph provided by one of the scientists criticized in the video, John Christy of the University of Alabama, Huntsville.
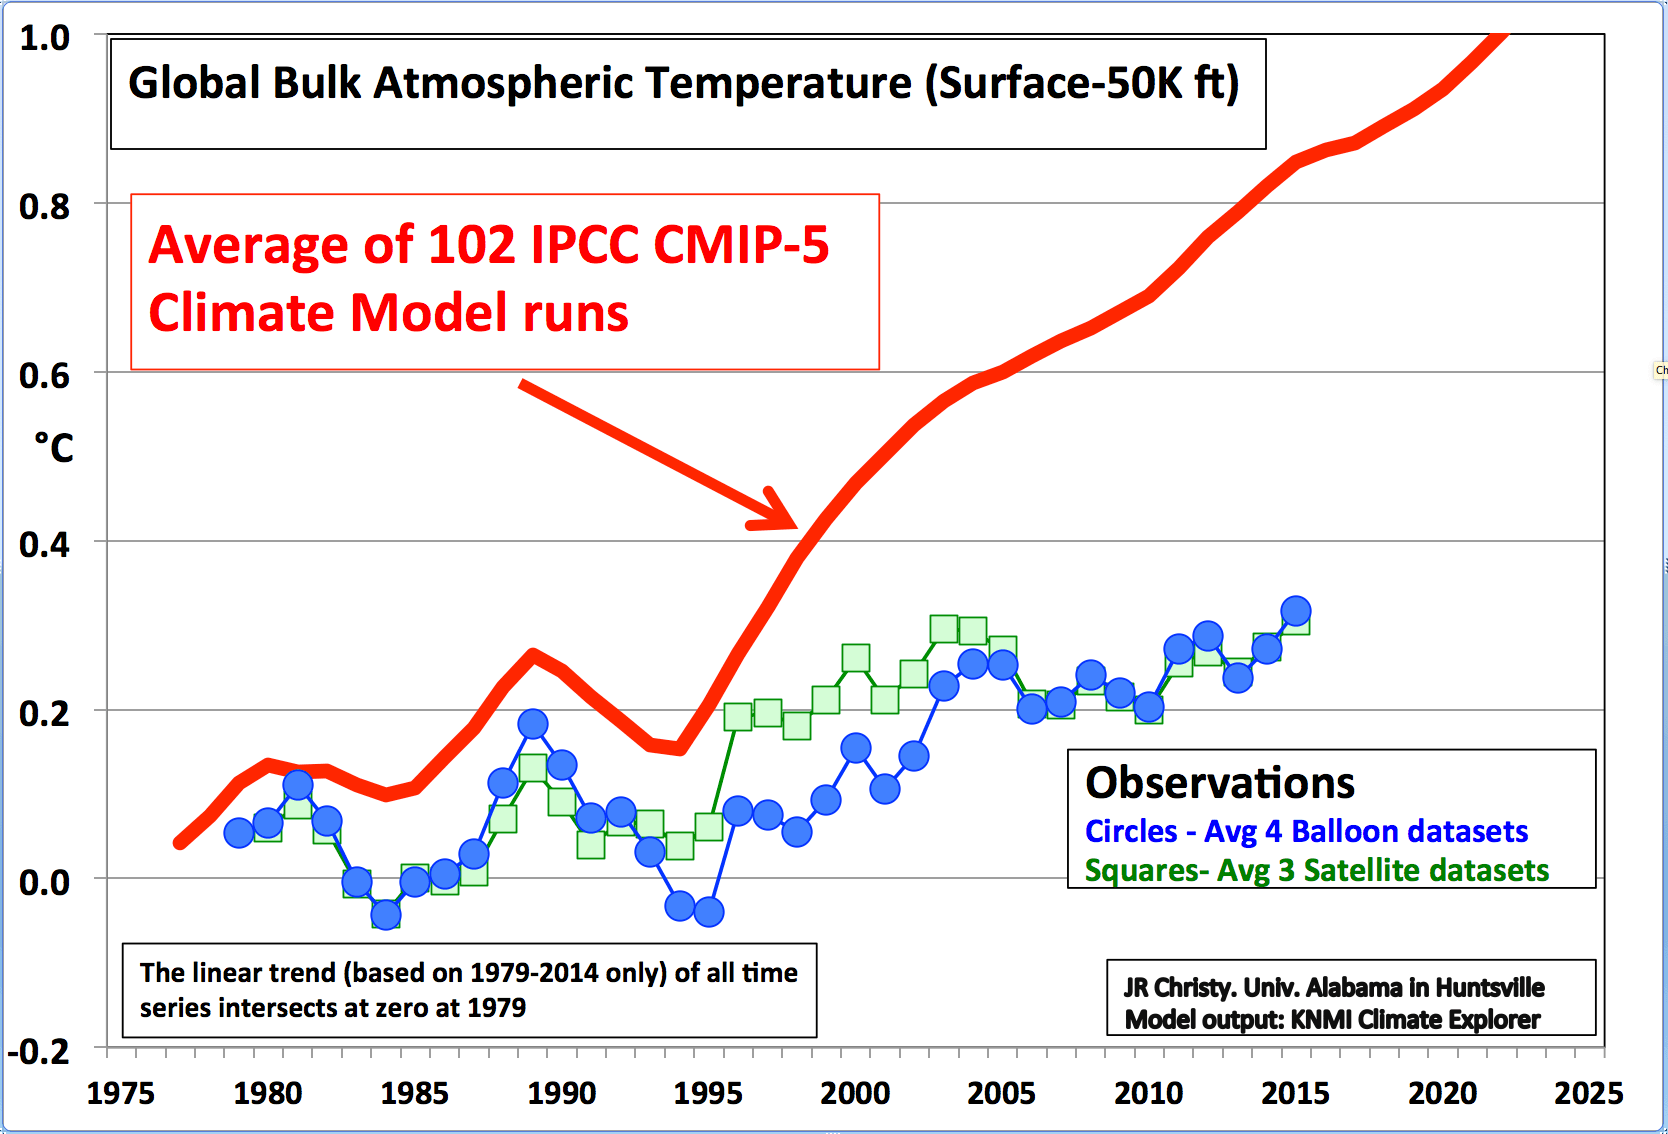
What it shows is how closely the satellite data corresponds with measurements taken using a completely independent system – balloons. If the satellites are lying then so are the balloons.
Christy told Breitbart:
There are too many problems with the video on which to comment, but here are a few.
First, the satellite problems mentioned here were dealt with 10 to 20 years ago. Second, the main product we use now for greenhouse model validation is the temperature of the Mid-Troposphere (TMT) which was not erroneously impacted by these problems.
The vertical “fall” and east-west “drift” of the spacecraft are two aspects of the same phenomenon – orbital decay.
The real confirmation bias brought up by these folks to smear us is held by them. They are the ones ignoring information to suit their world view. Do they ever say that, unlike the surface data, the satellite datasets can be checked by a completely independent system – balloons? Do they ever say that one of the main corrections for time-of-day (east-west) drift is to remove spurious WARMING after 2000? Do they ever say that the important adjustment to address the variations caused by solar-shadowing effects on the spacecraft is to remove a spurious WARMING? Do they ever say that the adjustments were within the margin of error?
He adds:
I’m impressed someone went to so much trouble and expense. The “satellite data” must be a real problem for someone. Do we know who financed this video?
Yes, we do. It was made by the Yale Climate Connection and part funded by the Grantham Foundation. The Grantham Foundation is the creation of a UK born US based hedge funder called Jeremy Grantham (and his wife Hannelore) and has since 1997 been at the forefront of promoting climate alarmism.
Among the beneficiaries of Grantham’s green largesse are Lord Stern — author of the heavily discredited Stern Report, now with a cosy sinecure at the Grantham Institute — and Bob Ward, a failed paleopiezometrist and crop-headed pit bull impersonator who is lavishly funded to write angry letters to newspapers and other institutions explaining in boring detail why climate change sceptics are evil and wrong.
As for the motivation behind this well-funded smear video – it’s actually explained at the website which is promoting it.
In coming days, we will hear announcements from NASA, NOAA and others that 2015 was the hottest year in the modern instrumental record.
There will be pushback from the likes of climate denier Ted Cruz, who uses a misreading of satellite temperature data to claim, as he did on Seth Meyer’s show – “no warming in 18 years”
This is the story of how that distortion came to be.
In other words it’s yet another case of the increasingly desperate climate alarmists playing their usual game:
If the facts don’t suit your discredited theory, change the facts.
Of course, there was a time when satellites and surface datasets followed each other closely, rising till 1998, and pausing since.

Even the Met Office had to admit the pause in 2013:


https://notalotofpeopleknowthat.wordpress.com/2015/06/09/the-met-office-the-pause-2/
But the pause was rather problematic, so it was adjusted out of existence. HADCRUT3 was dropped and replaced with HADCRUT4, while NOAA and NASA were busy magicking a warming trend out of thin air.

They claim that their previous versions (which NOAA and NASA have failed to archive) were grossly in error. Now they expect us to believe that the satellite data before 1998 was pristine, whereas the more recent stuff is wrong!
Utterly shameless!
Comments are closed.

When did science change from people of integrity working away in labs to the production of propaganda videos for the purpose of advancing agendas (either personal or political)?
When did the majority of real scientists stop heaping ridicule on those who put their names to such things?
Who would believe any measurements from satellites or balloons?
Climate models are always right, and the adjusted data prove it.
The pigs are flying high today.
How hot are the pigs?? Ideal data i’d have thought.
How hot are the pigs?? Ideal data i’d have thought.
Several years ago I coined the terms “Trenberth Events”. There were negative ones – when observations didn’t show something expected by the alarmists – and positive ones – when observations showed something unexpected by the alarmists. Both Events, however, caused the same response: the observations, not the expectations, were in error.
The lack of warming in satellite/balloon records is a Negative Trenberth Event. It is similar to the Negative Trenberth Event (that started the series) of the “missing heat”. Trenberth said it was “hiding in the oceans”, I.e. Oobservations were inadequate or insufficient to reflect what he knew was REALLY going on. The increase of ice in Antarctica was/is a Positive Trenberth Event: wasn’t supposed to happen, so what was the response? We were looking at the wrong area of Antarctica AND the ice we thought was important was THINNER than we thought. Again, the observations, not the expectations were wrong.
If the disconnect continues, we should see HadCru come under a serious attack by Trenberth et al. We’ve already seen Mann say the Gulf Stream is slowing down – by looking at wind data (and dendrochronology) rather than current data. The current data is deemed “wrong” . NOAA “fixed” global temperatures without using ARGO data, and removing daytime SST data: the ARGO data was “wrong” in reflecting surface air temperatures, and the daytime SST data was “wrong” because sunshine affected it. Note that daytime temperatures are not “wrong” for land based collection. That would be too much – maritime temperatures are things ordinary people aren’t familiar with, or at least the collection of them. And metal ship surfaces are easy to imagine having a local heating effect, unlike – !!!! – airport runways and air conditioner vents.
Lysenko did have his detractors early on. I’m betting he said their data was wrong. When putting wheat seeds on the surface of remaining snow failed to produce bumper crops, the error was said to be poor dispersal by those unwilling to have the new techniques succeeded (reactionaries and social saboteurs). We’re seeing it here with the attack on satellite data.
Perhaps it is the science equivalent of political no-error: the people do not disagree with the President’s position because his position is wrong, but because they have been misinformed by malevolent nay-sayers.
Thanks, Paul. I don’t think the satellites are wrong

UAH and REMSS are now in agreement.
I rather trust the continuous satellite measurements than the very sparse, ill-situated and adjusted thermometers.
See
from
http://www.ncdc.noaa.gov/oa/climate/research/ushcn/ushcn.html#QUAL
Dellers always writes great articles.
What’s interesting is that the poles are cooling.
In UAH SoPol for 2015 was the 3rd coldest year in the satellite record, (35th out of 37)
RSS 60-70 south was in 29th place.
If you look at UAH NoPol since 2005, you can see a solid cooling trend interrupted only by a jump in 2010.
Once this current El Nino subsides, the back calculated pause will lengthen rapidly as the temperatures drop in the satellite data.
We may even drop to temps of around the 1970’s making the pause take up the whole of the satellite data.
Temperatures will, of course, continue to climb in NOAA’s surface fabrication, even if the world becomes covered in ice.
And Paul, your last graph from WFT, is looking at things the wrong way. The 1998 – 2001 El Nino and related events gave a step change of about 0.26C, and that step is in fact the only warming in the satellite data.
Your graph should look like this, showing that the warming prior to the step and been cancelled by the cooling after the step. The slight up-tick of the current El Nino will also be cancelled by this time next year.
Paul, wanted to pop in and say, ‘Great Post, thanks’. Spent more time this PM over at WUWT, cause it is apparent Cruz staffers read it. Where else would they get Monckton’s pause chart? Thought your refutation sound. Still need counter sound bites, because Grantham’s Bob Ward will be all over this in the UK.
‘Turns out the satellite data is lying.’
All original climate data is lying in their world, that’s why they’re so often ‘adjusting’ it.
When you think everything is wrong all the time, a hard look in the mirror may be called for 😉
“All original climate data is lying in their world, that’s why they’re so often ‘adjusting’ it.”
That the MSM and gubberment don’t throw that back in their face sums it all up, really.
Reblogged this on Climatism.
Reblogged this on Climate Collections.
The only surprise here is it’s taken them this long to attack the satellite data. Btw, yet again it’s classic Lefty attack tactics: smear and discredit the target (person, organisation, data set etc) and therefore discredit whatever it is they’re saying. A balanced video would also point out the deficiencies in their argument and the advantages of satellite data, but of course there’s zero chance of that. Propaganda, nothing else.
So the climate “scientists” are doing science by video now, are they?
Whatever happened to peer reviewed publications?
I smell desperation!
Reblogged this on WeatherAction News.
The epitome of irony: values that are uhi (and other factors)-affected, adjusted, re-adjusted ad nauseum and homogenised, are considered more trustworthy than satellite and balloon measurements, that suffer almost none of the pre-mentioned factors
Someone should confiscate whatever it is they’re smoking.