Surface Temperature Corroborated By Satellites – Met Office 2013
By Paul Homewood

We are assured by the crooks experts that the satellite temperature data must be wrong, as it keeps giving out the wrong message.

This is all very strange, because the Met Office’s Peter Stott told us only two years ago that changes in temperature observed in surface data records are corroborated by measurements of temperatures below the surface of the ocean, by records of temperatures in the troposphere recorded by satellites and weather balloons,

http://www.metoffice.gov.uk/climate-guide/science/temp-records
This backed up what the IPCC had said in their Fourth Assessment Report in 2007:
Lower-tropospheric temperatures have slightly greater warming rates than those at the surface over the period 1958 to 2005.
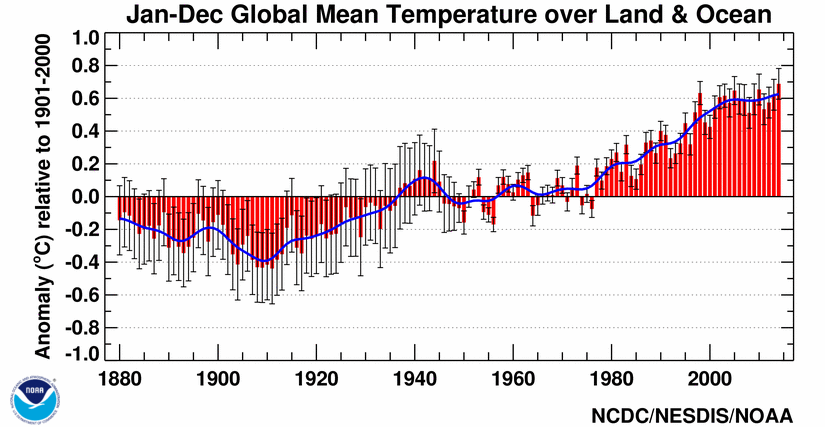
The radiosonde record is markedly less spatially complete than the surface record and increasing evidence suggests that it is very likely that a number of records have a cooling bias, especially in the tropics. While there remain disparities among different tropospheric temperature trends estimated from satellite Microwave Sounding Unit (MSU and advanced MSU) measurements since 1979, and all likely still contain residual errors, estimates have been substantially improved (and data set differences reduced) through adjustments for issues of changing satellites, orbit decay and drift in local crossing time (i.e. diurnal cycle effects). It appears that the satellite tropospheric temperature record is broadly consistent with surface temperature trends provided that the stratospheric influence on MSU channel 2 is accounted for. The range (due to different data sets) of global surface warming since 1979 is 0.16°C to 0.18°C per decade compared to 0.12°C to 0.19°C per decade for MSU estimates of tropospheric temperatures. It is likely, however, that there is slightly greater warming in the troposphere than at the surface, and a higher tropopause, with the latter due also to pronounced cooling in the stratosphere.
Woodfortrees comfirms that Hadcrut surface and RSS satellite data followed each other closely up to the end of 2005, as the IPCC reported.

This is not the first time that the climate establishment has attempted to discredit the satellite data. Last year, Katharine Hayhoe claimed in a CNN report that there were errors in troposphere data, which are commonly misused by climate skeptics. The link she gives refers to this NOAA report from as long ago as 2006:

https://notalotofpeopleknowthat.wordpress.com/2015/08/07/how-climate-scientists-cheat-and-deceive/
Note that it states this significant discrepancy no longer exists because errors in the satellite and radiosonde data have been identified and corrected.Also that for recent decades, all current atmospheric datasets now show global-average warming that is similar to the surface warming.
We can expect these attacks to go on.
Comments are closed.

Reblogged this on Climatism and commented:
They’re trashing sat data before the post El Niño cooling kicks in this year, trashing their theory even more….tick tock.
Translation: We made all the data match our theory, so stop saying bad things about us.
Or:
The data failed us so it was necessary to select new data.
This is all just posturing to get ready for what is going to come next. It hasn’t been good enough to use false data and to attack the opposition for these corrupt scientists to push their thieving agenda to obtaining grant money and bogus scientific acclaim. Now, the present El Nino is more or less a dud, and the La Nina cycle is soon to begin. With absolutely no significant warming to alter the long term temperature average of the globe, there is a serious, actually better than serious, more like certainty, that with the oncoming La Nina, we will see not just The Pause continuing, but there will commence to show an actual cooling trend. So much so, that if La Nina does its usual thing, this trend will not be just 18 years and 9 months, but could very well show a trend for over 20 years.
Take a look at the data,
you will see temperature peaks in ’96, a normal La Nina, will bring into the average the ’96 peak, and thus extent the pause or show a cooling of over 20 years. Furthermore, there is an even larger peak during ’91, and another even larger at the end of ’87. It will be very interesting to see what the next El Nino will bring, after all, El Nino is the only REAL physical event that the Warmers have to defend their miserable thesis. Factoring a La Nina that brings in cooling temperatures, and that high during ’96, we could very well be talking about a broad high temperature peak that is now ending, and that we will now find a long term cooling trend.
Furthermore, if you separate the rise from the late ’70s to late ’90s, you will see there is no other periods that show any rise in temperature that go linearly with human development. That rise you see in the late 19th century to early 19th century has a corresponding fall during the early 19th century, that is if Man created one it must be argued that Man created the other. Which is nonsense. This only leaves the 20 odd years for 1978 to 1998. How can anyone assume anthropogenic causes for only during 20 years between 1978 and 1998, and not during other periods when there were no temperature rises but still massive human development around the world.
AGW IS DEAD. The only people keeping it alive, are crooks, thieves, and fraudsters. And I might add, also those who hate humanity, namely, the Greens. You know the same Greenies that cruise around the world on ships that run on diesel but want everyone else not to, and so on.
When are people are going to finally wake up and understand this is all about scamming people out of their wealth. This whole AGW thing is just a con job, by very smart people who think that can use their academic credentials and make some fast money. Its time to put these people in prison. We put people in prison when they steal from the government when they lie about taking pensions falsely, we put people in prison when they do insurance scams, we put people in prison when they do financial scams, alla Enron, we put people in prison when they con people to invest in false gold mines….. BUT… we don’t put people in prison who falsely CREATE, INFLATE, MODIFY, data, so that they can win grants of millions of dollars, or win jobs and positions of high pay!! WHY NOT!
Yes, Dorian, thanks.

I thought the last such graphic by the NOAA, National Climatic Data Center (NCDC) was stored at
But the one you show is more recent:
Please tell me, in which NOAA page did you find it?
Well Dorian – Italy has already put vulcanologists in prison for negligence.
Given the widespread “adjustment” of all the surface datasets – always warmer in the recent and always colder in the past – I don’t think those who have falsified data should feel too comfortable. Some governments are already investigating how warming trends have been created out of even cooling trends in the raw data.
Thanks, Paul. Your article shows how
crookslike to cook their data; well-done in the present, rare in the past.Reblogged this on Climate Collections.
‘New datasets have been developed.’
You bet.
I have very recently received a response re climate change science, via my MP, from Amber Rudd MP. Beyond the usual non-sense, she made this bizarre statement re the satellite temperature record:
“On your constituent’s point about the apparent lack of warming over the past 18 years
shown by satellite measurements, one reason for that is that these measurements are
much more sensitive to climate phenomena such as ‘El Niño’ in the Pacific, which can
skew temperature trends over shorter periods. A more reliable picture of climate change
can be gained from looking at other measurements, such as the surface temperature
increase over the same period, ongoing sea level rise and other climate indicators, all of
which show a clear sign of warming.”
That’s about it on that topic, but some of the other assertions she makes are just as daft, perhaps worse.
If she really believes that, then she shouldn’t be in charge of a whelk stall, never mind the DECC.
The reply will not have been written by Amber Rudd, but by one of her civil servants, who themselves will quarry information from existing material within their Department. This is why it is so difficult to change official thinking. Attempts to turn the ship only spark re-affirmation and defense of an existing position. There is no will, and certainly no attempt, to engage with constructive thought.
Have the warmists ever answered the objections that:
1. 70 % of the surface of the earth, that is, the oceans,( and the even Southern Hemisphere) have few if any reliable surface temperature measuring equipment of value
2. they have never explained how they calculate the “average” for “global temperature”
3. they have never provided a physical or mathematical justification as to the validity of the “average global temperature” algorithm
4. both mathematicians and physicists have argued that “average global temperature” is a meaningless idea and cannot be calculated for an intensive variable like temperature on a planet that is not in thermodynamic equilibrium.
I have asked the same questions. Does anyone have a response?