Met Office UK Temperature Series Running Hot
By Paul Homewood

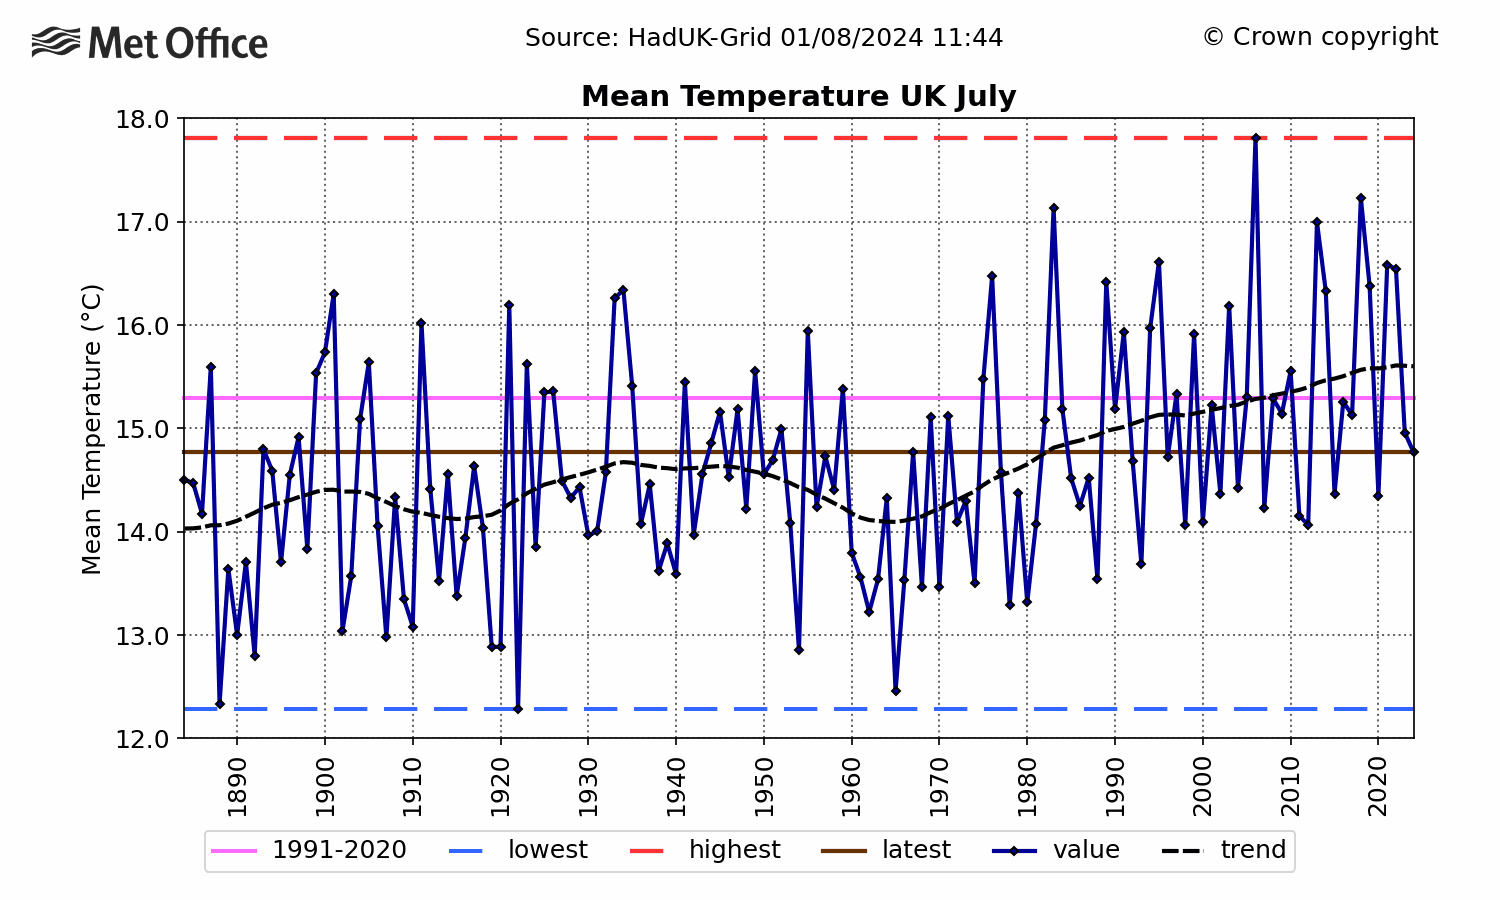
I noted the other day that, according to CET, last month was only the 21st hottest July since 1878. This was based on daily max temperatures; using daily mean temperatures, it was the 32nd warmest since the start of records in 1659.
I was therefore astonished when the Met Office grandly announced it was in fact the 5th hottest July on record for the UK as a whole. Of course, it may be that other parts of the UK were relatively hotter than central England. However, when we look at the Met Office series for the Midland region, which is a similar area to that covered by CET, we find that it was still ranked the 7th warmest, (in a tie with 1976).
The Met Office UK series only goes back to 1884, but according to CET last month was still only the 14th hottest since 1884.
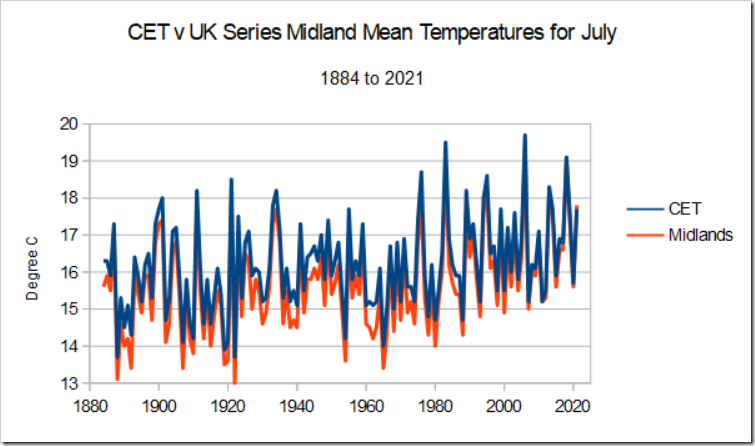
Clearly something does not stack up. Below is a chart comparing July mean temperatures for the two series:
https://www.metoffice.gov.uk/research/climate/maps-and-data/uk-and-regional-series
https://www.metoffice.gov.uk/hadobs/hadcet/data/download.html
You can see that Midland temperatures tended to be below CET, but gradually have closed the gap. We can see this more clearly below:
Although there has been variability from year to year, there has been a clear upsurge in the Midland temperatures relative to CET since around 1990. Up until then, the average difference was minus 0.6C. This year, the Midlands temperatures are 0.1C higher.
In other words, the Midlands appear to be warming about 0.7C faster the CET. Two possible reasons may explain this:
1) UHI
2) A change in station mix.
We know that the Met Office’s UK temperature series includes garbage like Heathrow and many totally unsuitable urban sites. In contrast, the CET is based on rural stations, with careful homogenisation when station changes take place.
The CET is only based on three stations, but as the Met Office Hadley Centre states:
These daily and monthly temperatures are representative of a roughly triangular area of the United Kingdom enclosed by Lancashire, London and Bristol
Representative being the key word.
The Met Office would argue that their series gives a better reflection of area temperatures, because it uses many more stations. However it is not the “actual” area temperature which matters, this is of purely academic interest. What matters is the time trends. There is consequently a very real risk that urbanisation and changing station mix is corrupting their series.
This, of course, is not the first time we have seen a large discrepancy like this between the UK series and CET. According to the Met Office, the summer of 2018 was the hottest on record, both for the UK as a whole and for the Midlands. The CET came to a very different conclusion – it was only the 5th warmest and a full half a degree cooler than 1976.
It is plain that the Met Office UK series is now running at least half a degree too hot, in summer at least, and that this discrepancy is not just a one off blip.
The comparison with July 1921 is particularly pertinent one. CET says that month was 0.8C hotter than last month. Yet according to the Met Office Midland series, it was only 0.1C hotter. We have a useful crosscheck at Radcliffe Observatory in Oxford University, where it was 0.65C warmer back in 1921. This would seem to provide added weight to the suspicion that the UK series is now unfit for purpose.
For confidence to be restored in its UK series, the Met Office should immediately exclude all data from Heathrow and all other unsuitable urban and airfield sites.
But, of course, they won’t do that, because that would rather ruin their agenda.
Comments are closed.


Fraud, plain and simple.
Heads should roll.
But of course…
Brilliant analysis once again Paul, thank you.
In 1976 The hot weather started in May and went through to September with no rain. We had water restrictions and stand pipes in the street to get our water from. So one or two day in a July is hardly the same is it.
There are lies, damned lies and statistics. Thank you Paul for calling out their rubbish and keeping us informed of their latest garbage.
Good work, Paul.
KBO!!
Are they not aligning with NOAA/GISS etc?
Great work again, Paul. They must love you at the Met Office
!
Speaking of misinformation, here’s another dose of climate bO11ocks, this time from our hysterical chums at the Guardian.
Headline: ‘Climate crisis: Scientists spot warning signs of Gulf Stream collapse’
Sub heading: ‘A shutdown of the Atlantic currents would have devastating global impacts and cannot be allowed to happen, researchers say’.
Last sentence: “These signs of decreasing stability are concerning. But we still don’t know if a collapse will occur, or how close we might be to it.”
In other words, they have NO EVIDENCE WHATSOEVER to suggest there’s a Gulf Stream collapse, whether imminent or centuries away, or whether it will even occur at all.
It seems one thing climate bedwetters do have in common is the ability to create a ‘story’ out of thin air.
https://www.theguardian.com/environment/2021/aug/05/climate-crisis-scientists-spot-warning-signs-of-gulf-stream-collapse
I have to disagree. The Gulf Stream shutting down can only mean one thing – disaster! We are all going to be an awful lot heavier – I have enough trouble with that as it is.
For billionaires it means making do with a Learjet.
How can you spot a “warning sign” of something if you don’t know if it’s a warning sign? They’ve seen something new and so interpreted it according to their dogma. Not science then.
I was in London summer of 1976. It was warm (for them). The heat warped the train tracks, impairing service. I am unaware of any such disruptions since.
The monthly mean CET has an adjustment applied each month for urban heating so the observed value is reduced, currently by 0.2C, I think. The value for the Midlands, or the other regions for that matter, presumably do not.
Paul – please don’t use the word ‘homogenized’. In the modern world it means ‘rigged by every solecism know to statistics to give the numbers we wanted’.
Best of all is the Aussie BoM – when their instruments record temperatures moderately below expected they simply declare them to be ‘offline’ and homogenize the data to give the numbers they thought they should have.
The MET Office is simply doing its bit for the Cause in the run up to COP26.
I check the Met Office UK Mean Temperatures every month. In the individual months’ data, for ten months of the year trends since about 2000 are shown as flat or falling, yet if you switch to the ‘annual’ figure, it shows a consistent rise over the same 20 yr period. The only explanation I can see is that the trends for July and August always show a totally different trend to the other ten months of the year (go to the latest figures, and compare July to any of the Jan-June months). These are somehow enough to drag the other ten months’ figures into a rising curve. Any idea how they pull this off?
Sorry, that should be June andJuly, notJuly and August.
There can be no reason whatsoever why over a 30 year period the Midlands should warm faster than the area covered by CET due to climate change.
It is fraud.
Since the 1980s, a lot of manufacturing has been off-shored and power station emissions have been cleaned up. The reduction in atmospheric soot and sulphur will surely have had some effect on temperature, especially in the Midlands?
If you look at the sunshine data for the midlands,
https://www.metoffice.gov.uk/pub/data/weather/uk/climate/datasets/Sunshine/date/Midlands.txt
The hours of sunshine have been increasing since 1988 which suggests to me clearer skies.
Baseline 1884 – why?
Krakatoa cooled the earth in 1883. But then again, anything the snivel serpents in Hadley tell it, their statistical analyses and data sets are as bent as a Boris Johnson – psyops covid announcement.
A brilliant article! Thanks for sharing! I too was surprised the month came out 5th warmest glad to find out the truth!
Please somebody contact the Met Office about this, it’s no use moaning and statistics can be interpreted different ways. The truth is most important so we should ask the Met Office for an explanation.
What about the 1911 United Kingdom heat wave?
The heatwave began around early July and ended two and a half months later, in mid September.
. . .
Eastbourne was very close to the levels of sunshine expected in Las Vegas and in the Nevada desert in the US for July.
https://en.wikipedia.org/wiki/1911_United_Kingdom_heat_wave